Fig. 2.1
A 64 year old male presents with right upper quadrant abdominal pain, nausea and vomiting. A right upper quadrant ultrasound (not shown) demonstrated right hydronephrosis. Axial (a) and coronal (b) contrast enhanced CT images demonstrate a mass filling and expanding the right renal pelvis. The mass extends into the right lower pole calices and down the proximal ureter resulting in hydronephrosis. This is a pathologically proven TCC. A right nephroureteral stent is in place (arrow)

Fig. 2.2
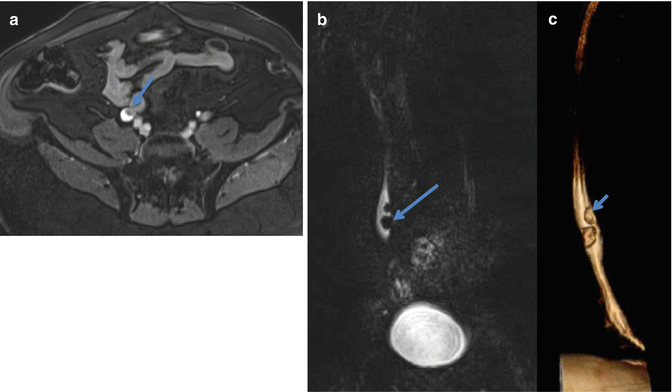
A 62 year old male with hematuria and MR urography was performed. An axial T1-weighted fat suppressed gadolinium enhanced MR image performed 10 min after contrast administration demonstrates a filling defect (long arrow) in the mid right ureter (a). The ureteral lesion (arrow) is well seen on the coronal T2-weighted TSE image (b) and on a volume rendered 3D reformatted image (c). Also note a synchronous smaller lesion just cephalad to the original lesion (short arrow in c). Both lesions are pathologically proven TCC
2.2.1 Computed Tomography Urography
General
CT urography is currently the most commonly utilized imaging modality in the diagnosis, staging and follow up of transitional cell carcinoma [3–6]. CT urography became feasible with the advent of multidetector CT in the late 1990s, allowing for imaging of the entire abdomen and pelvis in a single breath hold with thinly collimated images. The advantages of CT include high spatial resolution, optimal detection of calcifications, and superb assessment of the kidneys, collecting system and ureters as well as the perirenal tissues and remainder of the abdomen and pelvis. The disadvantages of CT include limited contrast resolution (when compared to MRI) and exposure to iodizing radiation. CT urography also necessitates the administration of intravenous iodinated contrast, which can result in allergic reactions or renal failure. In addition, CT urography relies on contrast excretion into the collecting systems. In patients with ureteral obstruction, contrast excretion may be inhibited, impeding adequate evaluation of the collecting system and ureter.
CT urography has a sensitivity of 96 % and a specificity of 99 % for lesions 5–10 mm in size with a drop in sensitivity to 89 % for lesions less than 5 mm and to 40 % for lesions less than 3 mm in size according to the European guidelines for UTTCC [3]. A recent meta-analysis of published literature reports CT urography to have a pooled sensitivity of 96 % and a pooled specificity of 99 % for the detection of UTTCC in patients presenting with hematuria [4, 6]. Given this favorable data, the American Board of Radiology and The American Urological Association Best Practices Policy guidelines recommend CT urography as the most appropriate initial imaging test for the evaluation of asymptomatic hematuria [5].
Techniques
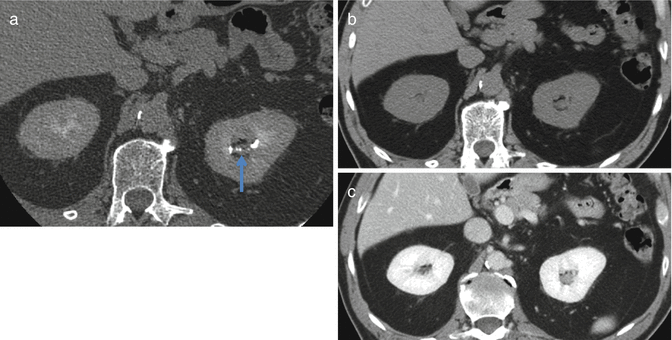
CT urography involves multiphasic helical imaging of the abdomen and pelvis without and with intravenous contrast. The pre-contrast scan is ideal to evaluate for renal, ureteral or bladder stones and serves as a baseline to assess for enhancement in a renal mass, if one is present. For the post-contrast portion of the exam, the American College of Radiology recommends administering 100–150 cc of 300–350 mg/ml non ionic intravenous contrast at a rate of 2–4 ml/s for the average sized adult [7]. There are a variety of methods of performing the post-contrast portion of the CT urography exam. A single bolus technique may be employed which consists of a single bolus of intravenous contrast (after the initial non-contrast images are obtained) followed by imaging of the kidneys during the nephrographic phase of enhancement (90–100 s post contrast injection) and a second post-contrast acquisition of the abdomen and pelvis during the excretory phase (5–15 min post contrast injection) [5]. The nephrogenic phase results in a homogenous nephrogram and is considered the best phase of enhancement to identify and characterize renal masses. Excretory phase imaging is used for assessing the collecting systems, ureters and bladder for non calcified filling defects, including TCC (Fig. 2.3). Overall, the single bolus CT urography technique results in a relatively high radiation exposure, equivalent to approximately 3 CT scans of the abdomen and 2 CT scans of the pelvis. Alternatively there are a variety of split bolus contrast techniques. In general, these consist of an unenhanced scan of the abdomen and pelvis followed by two reduced doses of intravenous contrast separated by 8–15 min (depending on the protocol) and with a single post contrast acquisition. The split bolus technique results in a combined nephrographic and excretory phase of enhancement which allows a single post-contrast acquisition. The advantage of this is a slightly reduced radiation dose corresponding to the elimination of one of the CT scans of the abdomen (the nephrographic phase in the single bolus technique). A disadvantage of the split bolus technique is that the contrast bolus is split, and therefore the combined nephrographic/excretory phase may not be equivalent to acquiring separate nephrographic and excretory phases.


Fig. 2.3
A 61 year old male with a history of hematuria. Axial contrast enhanced CT image obtained during the excretory phase (a) demonstrates subtle thickening of the left upper pole infundibulum (arrow) which is a proven TCC. On the axial unenhanced (b) and contrast enhanced (c) CT images the mass is very difficult to detect. This case demonstrates the utility of excretory phase imaging in detecting UTTCC
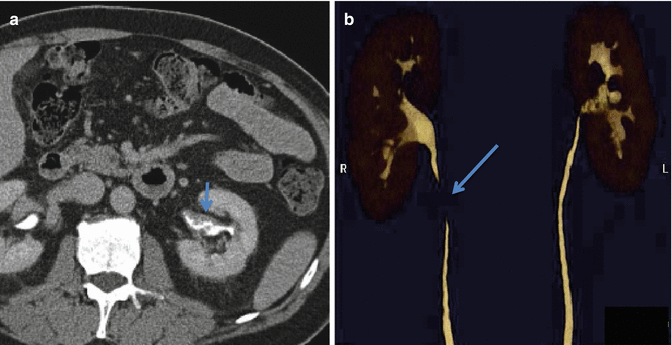
A shortcoming of CT urography is incomplete distention and opacification of the ureters secondary to ureteral peristalsis (Fig. 2.4). A few techniques have been evaluated to improve opacification of the ureters including supplementation with intravenous saline and/or intravenous furosemide. In one study, the addition of 10 mg intravenous furosemide given over 1 min helped opacify and distend the collecting system and ureters better than 250 cc intravenous saline alone. The study also demonstrated no additional benefit of combining furosemide with saline [8].


Fig. 2.4
A 56 year old male presents with hematuria. (a) Axial image from a CT urogram in the excretory phase demonstrates the utility of delayed contrast imaging to elucidate a transitional cell carcinoma presenting as nodular urothelial wall thickening (short arrow). (b) A volume rendered 3D image shows the irregular narrowing of the left renal pelvis. The discontinuity of the right ureter is due to poor opacification of the ureter with contrast secondary to peristalsis and is important not to mistake for disease (long arrow)
At Yale New Haven Hospital, we perform CT urography using a single bolus three phase (noncontrast, nephrogenic phase and excretory phase) technique in patients over 40 years of age and use a split bolus dual phase protocol (noncontast and combined nephrogenic/excretory phase) in patients under 40 years of age. Three-dimensional post-processing techniques including maximum intensity projections (MIPs) and three-dimensional reformation are helpful in evaluating the collecting systems in the coronal or oblique planes, can demonstrate the relationship between multiple lesions and provides urologists with a familiar imaging format (Figs. 2.2c and 2.4b).
Imaging Findings
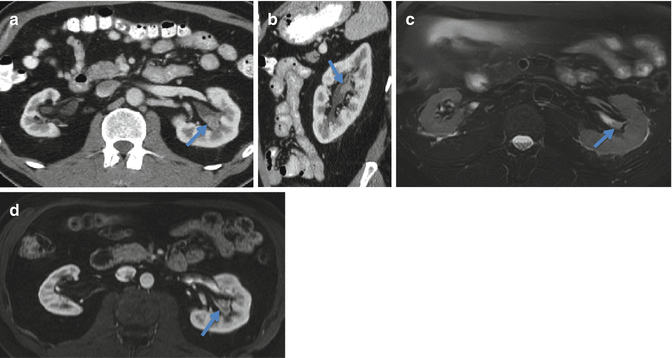
TCC can have many different appearances on CT imaging. Most commonly, TCC appears as an enhancing soft tissue mass within the collecting system or ureter [6] (Figs. 2.1 and 2.2). This may obstruct a portion of the collecting system or ureter proximal to the tumor. On precontrast images, TCC is typically slightly hyperdense with respect to urine. On post contrast images TCC often demonstrates early enhancement with subsequent washout on delayed images. TCC can be seen as a sessile (Fig. 2.5) or pendunculated filling defect, a mass infiltrating the wall of the collecting system/ureter which would cause pelvicaliceal irregularity (Fig. 2.4), or circumferential thickening of the collecting system/ureter (Fig. 2.6) which can obstruct the urinary system proximally. In the ureter, the distal ureter is the most common site of TCC, accounting for 73 % of all ureteral TCCs; 24 % occur in the mid ureter (Fig. 2.2) and only 3 % in the proximal ureter [6]. Eighty-five percent of UTTCCs are small, low stage, superficial, papillary neoplasms with a broad base and relatively benign course. Approximately 15 % are diffusely infiltrating tumors and these malignancies tend to present as large masses and have a more aggressive course (Fig. 2.7) [2, 9]. These extend in the renal parenchyma in an infiltrating pattern resulting in distortion of normal renal architecture.


