, Mark Thomas1 and David Milford2
(1)
Department of Renal Medicine, Birmingham Heartlands Hospital, Birmingham, UK
(2)
Birmingham Children’s Hospital, Birmingham, UK
Abstract
In this chapter we explain:
The common abnormalities found by ultrasound scanning the urinary tract
How urinary tract obstruction is investigated
How radio-isotope scanning measures kidney perfusion and excretion
How CT scanning is used to diagnose kidney stones
The risks and benefits of using radio-contrast
Ultrasound
The most common modality for imaging the urinary tract is plain ultrasound (Figs. 15.1 and 15.2).
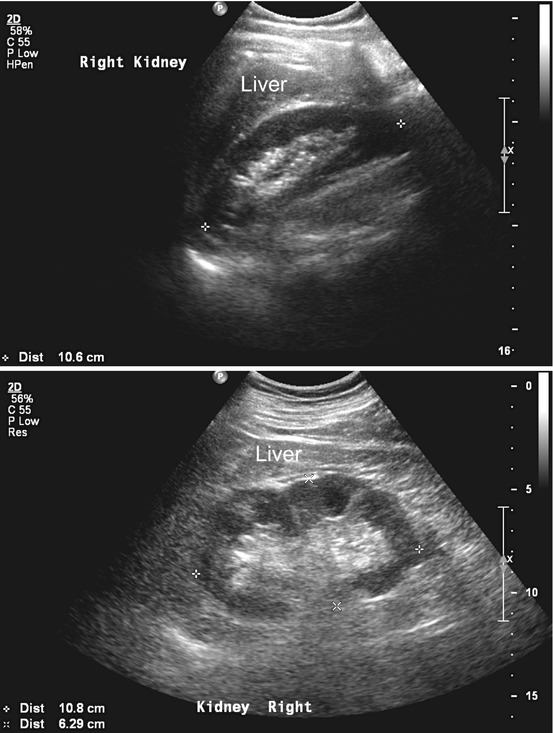
Figs. 15.1 and 15.2
Ultrasound scans of normal kidneys. The renal cortex is of the same or lower echogenicity (reflectivity) than the liver or spleen. The liver lies immediately superior to the right kidney. The centrally placed renal sinus fat is of greater echogenicity than both the renal cortex and the liver and spleen
Appearances in Kidney Disease
Changes to the ultrasound appearance are seen in both acute and chronic kidney disease. Cellular infiltration, interstitial oedema, sclerosis of glomeruli and fibrosis all non-specifically increase the reflectivity to ultrasound, or ‘brightness’, of the image. This is most easily judged by comparing the reflectivity of the renal cortex with the adjacent liver. The scan report may describe ‘increased cortical echogenicity’ and/or ‘loss of cortico-medullary differentiation’ .
The kidney may shrink in volume as chronic damage progresses and ultimately it can be hard to distinguish the kidney from the surrounding tissues (Fig. 15.3). Localised damage and scarring may make the outline of the kidney irregular (Fig. 15.4).
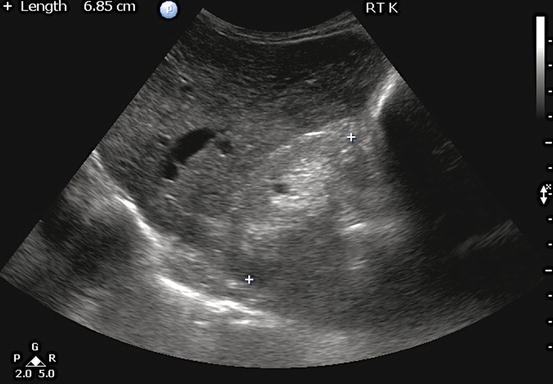

Fig. 15.3
Ultrasound scan of a small (6.85 cm in length) chronically damaged right kidney. The cortex is thinned and appears brighter than the liver, which lies above it. Both cortex and medulla are hyperechoic, obliterating the normal differentiation between them
Fig. 15.4
Ultrasound of a shrunken left kidney showing a large cortical scar at the mid-pole (arrow)
Cysts are a frequent incidental finding and may cause concern to the patient and doctor (Fig. 15.5). They may be multiple, large and in both kidneys (see Sect. “Cystic kidney diseases” in page 91). Patients with end-stage kidney disease often develop cysts in their small kidneys – acquired cystic disease – which uncommonly can progress to carcinoma.
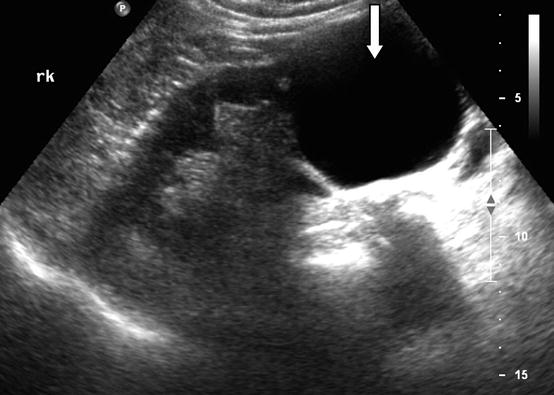
Fig. 15.5
Ultrasound scan of a right kidney containing a simple thin walled cyst on the lower pole, 6.2 cm in diameter (arrow). Otherwise the kidney is normal in appearance
Cysts are classified according to the presence of internal membranes (septa), calcification and solid structures within them – the Bosniak classification [1]. If the cysts have a thin wall and do not contain septa, calcification or solid structures, they are benign and of no clinical significance. In particular, they do not cause pain unless they become infected or there is bleeding into them.
In autosomal dominant polycystic kidney disease in adults the cysts are more numerous, the kidneys become enlarged and the remaining tissues are distorted (Fig. 15.6). Cysts may also be found in the liver and spleen.
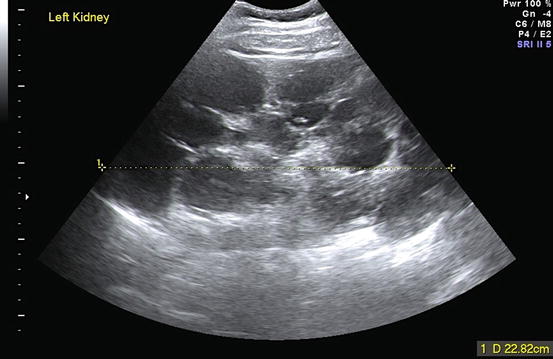
Fig. 15.6
Ultrasound scan of a grossly enlarged autosomal dominant polycystic kidney that was easily felt on physical examination
Urinary Tract Obstruction
Ultrasound is the first modality to use for detecting obstruction to urinary flow at any level of the urinary tract. In a hydronephrotic kidney, dilation of the renal sinuses and calyces is seen as a branching fluid space within the echogenic central sinus area (Figs. 15.7, 15.8 and 15.9). Occasionally, centrally placed cysts can mimic this appearance.
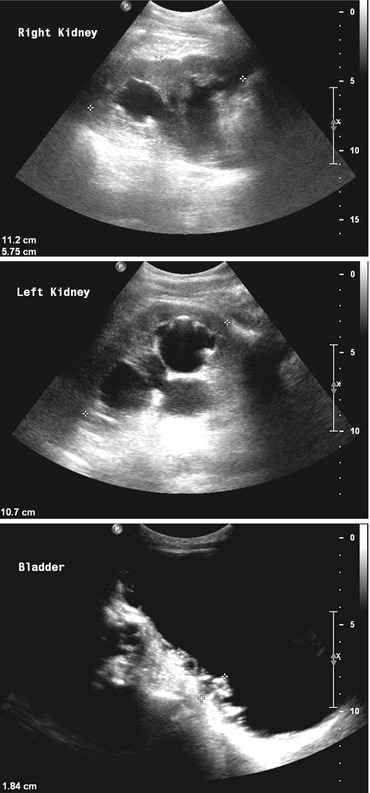
Figs. 15.7, 15.8 and 15.9
Ultrasound scans of the right and left kidneys and bladder in a patient with chronic bladder outflow obstruction. Both kidneys show gross hydronephrosis. The bladder is distended and the wall is thickened (1.84 cm) with an irregular trabeculated surface. In a man, these appearances are usually caused by prostatic enlargement. These images are from a woman with a urethral stricture
If the obstruction occurred very recently the kidney may appear entirely normal on ultrasound, with no visible hydronephrosis. If a patient has clinical features that suggest obstruction, even a suggestion of dilatation of the collecting system should prompt further studies (Patient 15.1 ).
Patient 15.1: Retroperitoneal Fibrosis
Mr. Castle, aged 60, went to donate blood and was found to be anaemic, Hb = 108 g/L. He had been tired over the previous 3 weeks but apart from some back pain had no other symptoms. As part of further investigation his eGFR was found to be 11 ml/min/1.73 m2 so he was referred to hospital urgently. He had no past or family history of kidney disease but was hypertensive, BP = 196/119 mmHg. His ECG showed left ventricular hypertrophy. Urine albumin:creatinine ratio was normal, 1.8 mg/mmol (15.8 mg/g). CRP was raised, 71 mg/L.
The report on an urinary tract ultrasound scan (Figs. 15.10 and 15.11) stated: “minimal fullness of the collecting system is noted bilaterally, otherwise both kidneys appear normal in size and echopattern. Renal lengths were: Right 10.7 cm, Left 10.4 cm. No scarring or obvious renal calculi seen.”
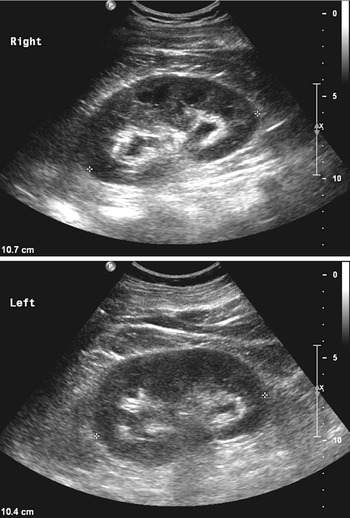
Figs. 15.10 and 15.11
Ultrasound scans of Mr. Castle’s kidneys
Doppler ultrasound studies showed normal kidney blood flow but there was considerable atheroma lining the anterior wall of the aorta, measuring 1.27 cm in AP depth (Fig. 15.12).
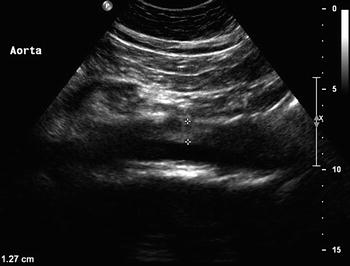
Fig. 15.12
Ultrasound scan of Mr. Castle’s aorta
The medical team interpreted the ultrasound scan report as indicating that there was no obstruction and he was referred to the renal medicine team. They reviewed the images and suspecting bilateral hydronephrosis they obtained a second opinion. This confirmed hydronephrosis and bilateral nephrostomies were inserted.
Nephrostogram studies showed dilated pelvicalyceal systems in both kidneys with medial deviation and narrowing of both ureters from L4 inferiorly (Fig. 15.13). This suggested bilateral extrinsic compression due to retroperitoneal fibrosis.
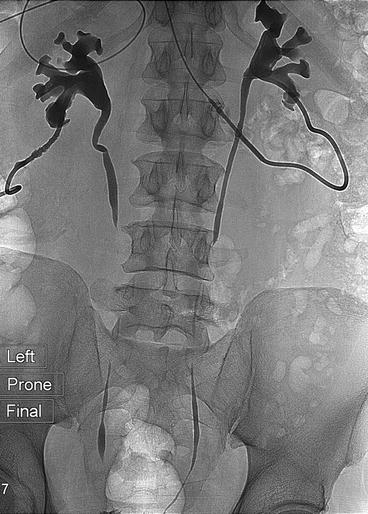
Fig. 15.13


Antegrade nephrostogram study showing dilated pelvicalyceal systems in both kidneys. The lower ureters are deviated medially and compressed by retroperitoneal fibrotic tissue
Related posts:


Stay updated, free articles. Join our Telegram channel
Full access? Get Clinical Tree
