The current American health care system is beyond repair. The problems of the health care system are delineated in this discussion. The current health care system needs to be replaced in its entirety with a new system that provides every American with first-rate, first-tier medicine and that doesn’t drive our nation broke. The author describes a 10-point Medical Security System, which he proposes will address the problems of the current health care system.
Our nation faces three interrelated and grave health care crises. First, more than 47 million Americans, including 8 million children, have no health insurance coverage. In 1987, the uninsured population totaled 32 million. In two decades, there has been nearly a 50 percent rise in the number of Americans without health insurance.
Second, Medicare and Medicaid costs threaten to bankrupt the country. Today’s elderly are now receiving more than $15,000 per year, on average, from these programs. In 2030, when all 78 million baby boomers are fully retired, the average benefit will exceed $25,000, in today’s dollars. This estimate is based on optimistic assumptions about benefit growth. In 2030, the two programs’ annual costs will run close to $2 trillion in today’s dollars.
These huge pending annual health care costs are largely responsible for the roughly $70 trillion fiscal gap that separates the present values of projected federal expenditures and receipts. This fiscal gap provides the true measure of our nation’s indebtedness because it puts all future net fiscal obligations, implicit and explicit, on an equal footing. Seventy trillion dollars is a huge amount of money, even for an economy as large as ours. It goes well beyond anything the nation can afford.
The third health care crisis involves enormous health care obligations facing employers, many of whom are drowning in health care bills and looking for the exit. Since 2000, the share of employees covered by employer plans has fallen by over one tenth – from 66 percent of employees to 59 percent. This decline is occurring, in part, from the closure of employer plans and, in part, from employees opting out of their employer’s health care plans when their employers invite them to share in paying for premium increases.
Employer-sponsored retiree health care plans are relics in the making. Many companies are freezing their retiree health plans; others are simply reneging in full or in part on past health care insurance promises. General Motors, for example, just handed over $32 billion in health care obligations to the United Auto Workers to get out from under the close to $47 billion in future health care benefits that it had promised its retirees.
The interconnections between the three crises are first order. Employers are reacting to the high cost of health care by eliminating their health plans. This is swelling the ranks of the uninsured. As the uninsured run out of funds to cover their health care bill, more and more end up on Medicaid. Since 2000, Medicaid enrollments have soared by 35 percent. And, to close the circle, the fee-for-service reimbursement system used by Medicare and, to a lesser extent, by Medicaid has contributed significantly to the overall rise in the price of health care and, consequently, to the health care costs employers now face.
Demographics and health care benefit growth—who’s going broke?
The United States, Spain, Japan, Norway, and Germany are some of the countries in deepest trouble, when measured by their fiscal gaps relative to the gross domestic product (GDP). The trouble stems from three sources: growth in government spending on retirement and health care benefits; growth in government purchases of goods and services; and changes in demographics.
Demographic change is already here. In Japan, 18 percent of the population is now 65 years and older. America’s oldest baby boomer is now eligible for early social security retirement benefits. The European and Japanese workforces are already shrinking, and Japan’s population growth rate is already negative. Europe’s population growth rate will turn negative in just 4 years.
As Table 1 indicates, the United States is now and will remain significantly younger than Japan and Germany. Canada’s elderly population share will be similar to that of the United States for the next three decades, but then Canada will get older than the United States. By midcentury, Canada’s oldsters will represent 26.7 percent of the population compared with 21.3 percent in the United States. In time, even China, which is now much younger than is the United States, will be older than the United States. Although the United States will be the young kid on the block, even the United States will look very old. The entire country will be older than current-day Florida. And there will be more than just a large number of oldsters. There will be a lot of old oldsters: people who are 85 years and older. Indeed, in 2050, there will be enough Americans who are 85 years and older to fill up all of New York City, Los Angeles, and Chicago. There will be enough centenarians to fill up all of Washington, D.C.!
| Country | 2005 (%) | 2030 (%) | 2050 (%) | 2070 (%) |
|---|---|---|---|---|
| Germany | 17.1 | 26.3 | 30.5 | 31.3 |
| Japan | 18.0 | 29.9 | 36.8 | 37.7 |
| United States | 12.4 | 19.1 | 21.3 | 21.6 |
| Canada | 13.0 | 23.6 | 26.7 | 27.1 |
| China | 7.6 | 16.3 | 23.5 | na |
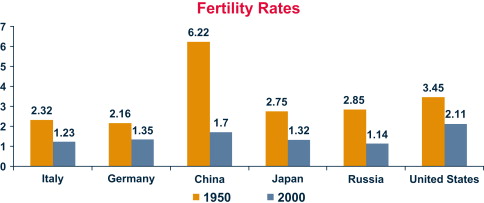
Fertility is the major force determining long-run aging. As Fig. 1 shows, postwar fertility changes have been extraordinary. In1950, the fertility rate in China was 6.22 percent; now. it’s about 1.7. In the United States, it was 3.45 percent; now, it’s about 2.11. There are also amazing fertility rates in Europe and Russia. Italy’s rate is currently 1.2 percent. In Japan, the rate is 1.3 percent. In Russia, it’s 1.1 percent. These incredibly low fertility rates presage, of course, major declines in population.

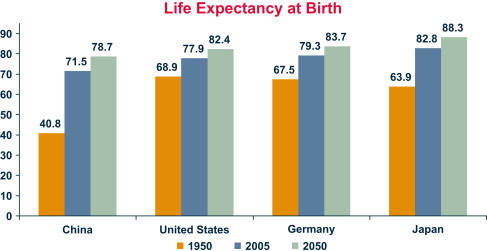
Longevity increases are also playing and will continue to play an important role in the aging process. Fig. 2 shows dramatic change – past and projected – in life expectancy in the United States, China, Germany, and Japan.

Consider Japanese newborns born in 2050. They will live, on average, to age 88. In 2050, the median age in Japan will be 52. In 1950, the median age in Japan was 22.
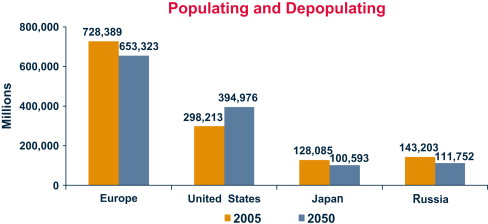
Past and projected fertility and longevity changes have important implications for total population sizes. As Fig. 2 shows, the United State’s population will expand by about 100 million people through the middle of the century. This is a projected 33 percent increase compared with the current total.
In Europe, there will be a major depopulation – by roughly 80 million – over the same time period. Russia’s and Japan’s populations will fall by about 20 percent. If fertility rates don’t turn around, by the end of the century, Russia’s and Japan’s populations will be roughly half of what they are today ( Fig. 3 ).

Paying the piper
These projected demographic changes are fascinating, but what are their fiscal implications? Consider the United States, which now spends over $30,000 per old person on Social Security, Medicare, and Medicaid. Medicare is the old-age health insurance program run by the federal government. Medicaid is the government’s health care program for the poor, including poor elderly in nursing homes. Because of the high costs of nursing homes, about 70 percent of total Medicaid expenditures is spent on the elderly.
If $30,000 seems like a lot of money, it is. It’s about 80 percent of United States per capita GDP. It’s higher than the GDP per capita in about 200 of the world’s 231 countries. However, by 2030, when the baby boomers are fully retired, the average benefit level per oldster won’t be $30,000; it will be at least $50,000 (measured in today’s dollars) and represent more than 100 percent of 2030 per capita United States GDP. The remarkably high levels of oldster benefits, current and projected, are due, in the main, to the growth in the health care component of total Social Security, Medicare, and Medicaid outlays.
The table below details real government health care benefit-level growth in the United States, Japan, Canada, and Germany between 1970 and 2002. In the case of the United States, the real growth rate of the benefit level (measured as Medicare and Medicaid expenditures per person at a given age) averaged 4.61 percent per year. In Germany, real benefit-level growth averaged 3.3 percent; in Japan, it averaged 3.6 percent. In the United States, the 1970–2002 health care benefit level growth rate exceeded the corresponding growth rate of per capita GDP by a factor of 2.3. The rate of growth of health care benefit levels in the United States and other countries is clearly unsustainable, but when will it end?
Stay updated, free articles. Join our Telegram channel

Full access? Get Clinical Tree


