, Mark Thomas1 and David Milford2
(1)
Department of Renal Medicine, Birmingham Heartlands Hospital, Birmingham, UK
(2)
Birmingham Children’s Hospital, Birmingham, UK
Abstract
In this chapter we explain:
How one patient’s experience changed a doctor’s practice
How to organise a community-wide kidney disease system
How it is possible to reduce the prevalence of end-stage kidney failure
To complete this book, I (HR) would like to tell you a story. One morning in 2004, I was in the diabetes outpatient clinic. Before calling the next patient into the room, I reviewed his laboratory results. The serum creatinine was 204 micromol/L (2.3 mg/dL). At that time, 200 micromol/L prompted referral by the diabetes team to the nephrologist.
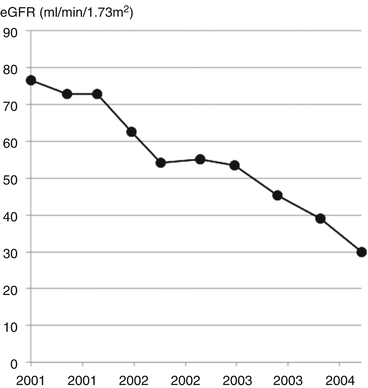
We were just starting to get used to using eGFR and I was surprised by how low it was in this patient – only 30 ml/min/1.73 m2. I thought it would be interesting to draw a graph of his results. Figure 19.1 shows how it looked.


Fig. 19.1
Graph showing a linear decline in eGFR
I was shocked to see that the latest eGFR was at the end of a linear trend that had been going on for years. This man’s kidney failure was predictable but we had not predicted it. And to make matters worse, the patient was a doctor!
He was upset when I showed him the graph and unimpressed that I had not taken the trouble to work this out sooner. To add to my humiliation, he asked for a second opinion. Since then, I have drawn an eGFR graph for pretty much every kidney patient I see.
A few days later, my bank telephoned me to enquire about suspicious transactions on my credit card. It turned out to be a false alarm. When I asked how their suspicions had been raised, the clerk explained that the bank’s computer had alerted them to unusual patterns of transactions on my account. From her tone of voice, she seemed surprised I was not already aware of this service!
Stay updated, free articles. Join our Telegram channel

Full access? Get Clinical Tree


