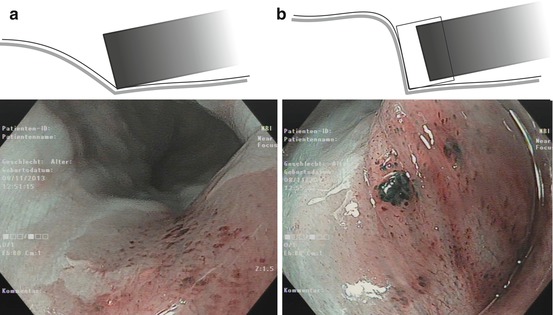
Fig. 4.1
(a) Schematic diagram of red-green-blue (RGB) sequential imaging system. (b) Schematic diagram of CCD-based, RGB simultaneous imaging system. CCD charge-coupled device. Fine-tuning of the system settings is essential for quality of enhanced imaging, especially of adaptive index of hemoglobin color enhancement (IHb) [10] (Modified from Uedo et al. [9])
4.2.1 Standard White Light (WLI)- and Chromoendoscopy(CE)
Screening and surveillance use WLI endoscopy for detection of early neoplasias focusing on changes in surface structure (epithelial architecture) and/or color of the mucosa. More reddish color of neoplastic lesions is due to increased vascular density of the lamina propria (LPM), decreased glandular layer, or both alterations combined; more pale color reflects increased gland density, diminished vascularized connective tissue of LPM, or both factors combined. Rarely, neoplasias display the same color as the mucosa. Imaging of epithelial surface structure and mucosal color is important for sensitive detection with standard WLI and/or IEE of suspicious lesions. The analysis of suspicious lesions is facilitated by HD endoscopy and often feasible only with enhanced magnification imaging (60–120-fold) of microsurface and microvascular patterns in WLI and NBI technique [8].
Chromoendoscopy (CE) with acetic acid or indigo carmine enhances the surface structure, whereas Lugol (iodine) solution reacts with squamous epithelial cell membranes; methylene blue and crystal violet are internalized into columnar epithelial cells [1, 11]. Indications for and principle of CE are given in Table 4.1. For application of CE, wash the mucosa and lesion with water containing simethicone – and pronase (s. Chap. 1) or 1 % acetylcysteine before absorptive stain – apply dye solution (e.g., 10 mL) for about 1 min, and wash again briefly before imaging. Esophageal squamous neoplasias show Lugol-unstained area, and appearance of slight pink coloring in unstained area after 1–2 min is highly specific for cancer (pink coloring sign) [12]. Neutralize the irritant action of Lugol solution immediately after iodine CE using sodium thiosulfate (5 % aqueous sol., twice the volume of Lugol solution) [13]. Crystal violet staining is most accurate for irregular colonic microsurface (pit pattern type V; compare Chap. 10).
Table 4.1
Gastrointestinal chromoendoscopy and virtual chromoendoscopy (NBI)
A. Indications | ||
Location | Neoplasia | Dye solution or VCE (NBI) |
Esophagus | Squamous cell cancer | Lugol staining/NBI |
Barrett’s cancer | Acetic acid (AA)/indigo carmine (IC)/NBI | |
Stomach | Gastric cancer | Indigo carmine (IC)/AIMa/NBI |
Colon | Adenoma, HGIN, CRC | Indigo carmine (IC)/crystal violet/NBI |
B. Application and principle of staining | ||
Principle | Solution | Target structure/cells |
Reactive | Iodine-potassium iodide (0.75–1.0 % aqu.) (Lugol solution)a | Squamous epithelial cell (SC) membranes; SC cancer: unstained area with clear demarcation line, “pink coloring sign” after 2 min |
Absorbed | Methylene blue (0.2 % aqueous)b | Intestinal metaplasia |
Contrasting | Indigo carmine (0.15 % aqueous); AIMc(0.6%AA, 0.4%IC) | Identification of macroscopic type and border of lesion AIM, identification of lesion border |
Absorbed | Crystal violet (0.05 % aqueous)d | Colonic epithelium |
Note
CE characterizes surface pattern. NBI (or FICE, i-Scan) replaces the need for CE to assess the most mucosal neoplasias, whereas in doubtful situations CE better shows surface pattern and lateral margins of neoplasias.
4.3 Characteristics of Early Mucosal Neoplastic Lesions on WLI
Detection of a lesion depends on visible alterations in surface structure or color, while prediction of histological stage or invasiveness of a lesion rests on assessment of three criteria – macroscopic morphology, mucosal surface pattern (MSP), and capillary pattern (CP) of the mucosa – and is performed with magnifying image-enhanced endoscopy (narrow-band imaging or chromoendoscopy; see Sect. 4.3).
4.3.1 Macroscopic Classification (Paris-Japanese Classification)
The endoscopic classification developed in Japan [15] and promoted by international consensus in Paris is analogous for superficial neoplastic lesions of the esophagus, stomach, and colon [1, 11] (see Fig. 4.2a). Diagnostic failure mainly comes from a) misclassification of type 0–IIa versus type 0–Is lesions (which is of minor importance for cancer miss rates) and b) under-detection of type 0–IIc lesions which is a major cause for cancer miss rates, because even small 0–IIc neoplasias show a high rate of progression to invasive cancer [1, 7].
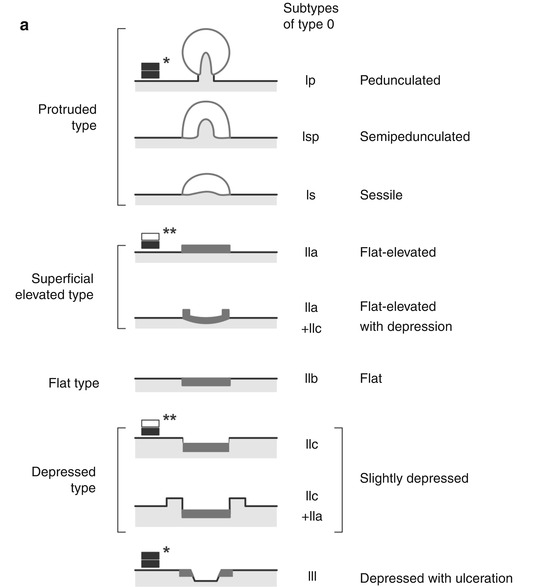
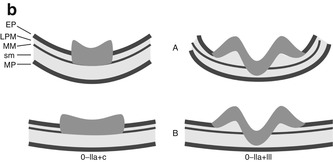
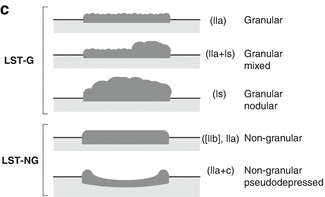


Fig. 4.2
(a) Endoscopic classification of superficial neoplasias of the digestive tract (Modified acc. to [1, 11]): The macroscopic type is evident from aspect of the lesion as compared to the size of a standard biopsy forceps (* closed cups of forceps = 2.5 mm, ** one jaw = 1.25 mm). Lesions are defined in relation to the adjacent surface as “protruding 0–I” (>2.5 mm↑ in columnar epithelium) and non-protruding, i.e., “flat-elevated = 0–IIa” (<2.5–0.5 mm↑), “flat = 0–IIb,” and “depressed 0–IIc” (0.5–1.25 mm↓) or “excavated 0–III” (>1.25 mm↓). Composite lesions are described according to the combination of surface subtypes. In esophageal squamous epithelium, only half the sizes are used for the cutoff lines, e.g., “>1.25 mm↑ for 0–I,” “>0.25 mm↑ for 0–IIa,” “>0.25 mm↓ for 0–IIc,” and “>0.5 mm↓ for 0–III.” *, ** standard biopsy forceps (*gauge closed = 2.5 mm, **one jaw = 1.25 mm) Fig. 4.2 (continued) (b) Desufflation (A)/insufflation (B) of visceral organ provides information on depth of invasive growth. Left: air-induced deformation of shape indicates infiltration of MM layer. Right: fixed shape of neoplasia indicates invasion of deep sm or MP layer. (c) Laterally spreading types of neoplasia (LSTs) [7]
Superficial protruding lesions (0–Ip, Isp, Is) are easily detectable. In the stomach, they comprise hyperplastic polyp (glandular cysts, multiple in chronic type B gastritis, 80–90 %), adenoma (5–10 %, with high risk of malignant foci) or differentiated adenocarcinoma (2–3 %), inflammatory polyps (e.g., eosinophilic granuloma, ~2 %), rarely fundic gland polyps (e.g., in familial adenomatous polyposis), hamartomas (e.g., in juvenile polyposis or Peutz-Jeghers syndrome), or hereditary polyposes (e.g., Cowden syndrome, Cronkhite-Canada syndrome). Protruding submucosal lesions must be evaluated by particle biopsy or EUS-guided fine needle biopsy to distinguish MALT lymphomas and submucosal tumors, e.g., carcinoid, lipoma, gastrointestinal stroma tumor, leiomyoma, and rare other tumors.
In colon, most mucosal lesions are protruding; about two-thirds are adenomas (some with HGIN or early cancer), and one-third are harmless hyperplastic polyps that must not be confused with serrated adenoma [1, 4, 11]. Submucosal tumors (lipoma, carcinoid [mainly in rectum], rare leiomyoma) are covered with normal or inflammatory mucosa and so are hamartomas (Peutz-Jeghers polyp and juvenile polyp) and inflammatory pseudopolyps. The latter predominantly occur in chronic ulcerative colitis (UC) that generally poses a challenge to detect and distinguish neoplasia from inflammatory regenerative alterations.
Flat lesions, i.e., slightly elevated, completely flat, and slightly depressed lesions (IIa, IIb, IIc), are less striking on WLI and deserve continuous attention for changes in color and/or surface structure of the mucosa in the esophagus, stomach, and colon. The majority of early cancers (75–80 %) in squamous and columnar epithelial esophagus and in stomach are flat lesions (IIa, IIb, IIc) [1]. Small early gastric cancers (EGC) typically display reddish type 0–IIc lesions when well differentiated and small pale type 0–IIb lesions, often with intact surface structure, when poorly differentiated. The latter are hard to detect and constitute about 15 % of flat EGC in Japan and a higher fraction (up to 40 %) in Western countries [16].
About 36 % of colonic neoplasias present type 0–IIa flat lesions, and about 2–5 % type 0–IIc depressed lesions [4, 7]. As the tumor progresses in size and sm invasion, flat depressed neoplasia (0–IIc) may gain an elevated hyperplastic rim (types 0–IIc + 0–IIa) and become entirely elevated (types IIa + IIc) or ulcerated (0–III) in case of deeply sm-invasive growth (Fig. 4.2a). Shape and deformation of a lesion during inflation/desufflation of the organ also provide information on invasive growth into muscularis mucosae or deep sm/proper muscle layer (Fig. 4.2b).
Laterally spreading-type neoplasia (LST) (Fig. 4.2c) has been defined by Kudo et al. as flat or elevated neoplastic lesion in the colon of more than 10 mm diameter [7]. These neoplasias (mostly adenomas) are barely distinguishable in color from the surrounding normal mucosa and can be quite flat or low elevated. Chromoendoscopy with indigo carmine is advisable to demonstrate tumor extension. Uraoka et al. characterized the spectrum of LST, including nongranular-type LST with high probability of malignant foci (up to 50 %) [17]. The risk of malignancy in granular-type LST is often considered low (<5 %), justifying piecemeal resection, but has also been observed as high as 25 % [17, 18].
4.4 Magnifying and Image-Enhanced Endoscopy (IEE) for Analysis of Microarchitecture
4.4.1 Magnifying Endoscopy
The importance of magnification for analysis of surface structure has been established in the colon [7], esophagus [19], and stomach [20]. High-definition (HD) endoscopes, even with the color CCD system, have a physical magnification up to 2 mm distance from the epithelial surface yielding an optical magnification of at least 45-fold. In combination with the 1.5 times digital zoom, these endoscopes offer at least 65-fold magnification (e.g., Exera II or Lucera, OLYMPUS). There are zoom endoscopes with adjustable image magnification up to 120-fold and depth of field (DoF) of 2–3 mm in both the sequential RGB and the simultaneous color CCD system. Moving the endoscope closer than 2 mm to or further than 3 mm from the tissue causes the image to go out of focus. Therefore, the use of a distal attachment on the zoom endoscope is essential to keep precise distance from the lens for clear, focused images (Fig. 4.3). With the dual-focus endoscopes (e.g., Exera III or Lucera Elite, OLYMPUS), the user can switch between standard mode and near mode for close focus observation (with wider DoF 2–6 mm).
4.4.2 Image-Enhanced Endoscopy (IEE)
Illumination of the mucosa with spectral light from band filters in the light source (narrow-band imaging NBI, Olympus) or computer-based filtering for spectral light bands in the image processor (e.g., FICE, Fujinon, or i-Scan, Pentax), as well as CE, augments the contrast and enhances visibility of structures (image-enhanced endoscopy, IEE) while changing the image color [8, 21–24]. NBI shows hemoglobin absorbance and thus presents images of the microvascular pattern in the superficial mucosal layer (lamina propria) and submucosal vessels. It is based on light filtering for dual narrow-band illumination. From the broadband white light of the xenon lamp, two bands are split with wavelength of 415 and 540 nm that illuminate the surface of the mucosa. The 415 nm blue light band improves the imaging of capillaries (showing up in brown) in the lamina propria (LPM), and the 540 nm green band focuses on small vessels in submucosa (in cyan) allowing to characterize the microvascular pattern (MVP) in normal and neoplastic mucosa [8] (Fig. 4.4). Image processor settings – fine-tuning of enhancement of lines, contrasting of outlines, and color tone – are essential for image quality of magnifying IEE using NBI [9, 10]. The Fujinon intelligent color enhancement system (FICE, Fujinon) is a computer-based system for enhancement of spectral light bands in the image processor. FICE yields IEE of mucosal surface structure and vascular pattern comparable to NBI [23]. The post-imaging digital filter technique (i-Scan, Pentax) is tuned for enhancement of surface structure (SE mode) or red-green-blue spectral bands for “tone enhancement” (TE mode) [21]. FICE and i-Scan use diagnostic principles established for NBI, and key findings reported for NBI also apply [8, 21–24].
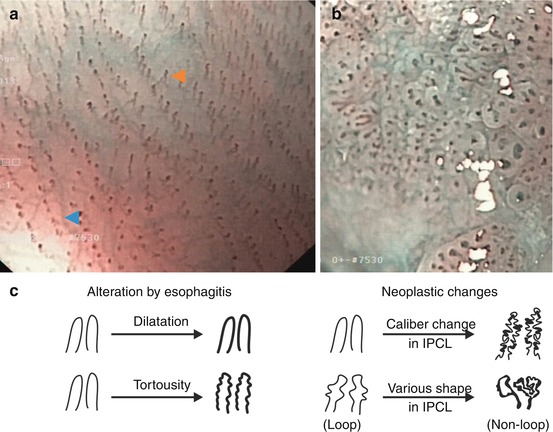

Fig. 4.4
Microvascular pattern (m-NBI, 60×) of squamous epithelial mucosa. (a) Normal esophagus. Faint submucosal collecting venules (cyan  ) and intrapapillary capillary loops (IPCL, light brown
  ) in LPM of squamous cell mucosa. (b) Neoplasia with HGIN. Disappearance of sm collecting venules, typical alterations of IPCL (thickness, curling). (c) Basic alterations of schematic IPCL structure modified from [9, 25]
 ) and intrapapillary capillary loops (IPCL, light brown
  ) in LPM of squamous cell mucosa. (b) Neoplasia with HGIN. Disappearance of sm collecting venules, typical alterations of IPCL (thickness, curling). (c) Basic alterations of schematic IPCL structure modified from [9, 25]
Note
Magnification (80- to 120-fold) combined with contrast-enhanced techniques (NBI, FICE, i-Scan, crystal violet CE) yields maximum performance for diagnostic analysis of early neoplasias (image-enhanced endoscopy, IEE).
4.5 Capillary Structure of Squamous Mucosa and Neoplasias
Squamous epithelial esophagus displays rows of tiny reddish dots on WLI, which are identified (on magnifying NBI) as intrapapillary capillary loops (IPCL) in papillae of mucosal LPM layer (Fig. 4.4a). Neoplasias in squamous epithelium induce angiogenesis and change vascular architecture of IPCL visible on IEE as alterations of IPCL morphology (Fig. 4.4b). Basic changes are in length (elongation), diameter (dilatation), irregularity in shape (non-loop due to fusion/destruction of papillae), and caliber (irregular caliber, thick vessels). This sequence of angiogenic alterations by early neoplasias (Fig. 4.4b, c) is well visible in squamous epithelial esophagus (Table 6.2) and, in analogous fashion, is known in early cancer of columnar cell-lined mucosa (compare below).
Key for IPCL
Length (elongation), diameter (dilatation), and tortuosity
Irregular caliber (thickness) and shape (loop/non-loop)
Note
Squamous epithelial esophagus is best screened with both WLI (on scope insertion) and NBI observations (on scope withdrawal).
4.6 Analysis by IEE of Columnar Epithelial Mucosa and Neoplasias
Columnar epithelial mucosa extends between the squamocolumnar junctions at cardia and anal channel and presents different surface patterns depending on the type of mucosal glands. Single-layered columnar epithelium (in intestine with mucin-rich goblet cells) covers the surface of mucosa and glands. Mucosa contains tubular glands with pitlike orifices in colorectum and gastric fundus/corpus (fundic-type mucosa) – displaying on IEE a pattern of regular pits in even mucosal surface. In antrum and pylorus and in Barrett’s esophagus, the mucosal surface forms villi or ridges surrounded by groove-like crypts; therefore, the surface pattern is villous (tubular) or gyrus (ridgelike). These basic patterns are also expressed in enhanced fashion by colonic adenomas, in classical adenomas without goblet cells. In small bowel, mucosal surface is entirely villous (tubular).
On NBI of columnar epithelial mucosa (Barrett’s esophagus, stomach, and intestine), the surface pattern of marginal crypt epithelium is superimposed onto the capillary pattern of the lamina propria – yielding complex surface and capillary patterns (CP) (Fig. 4.5).
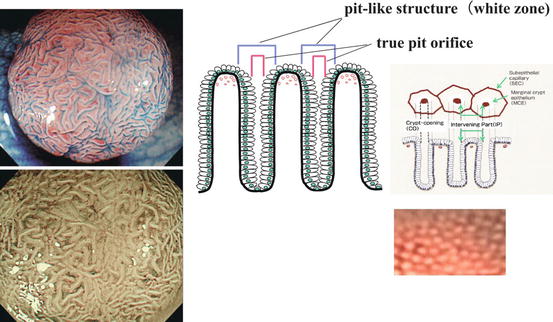

Fig. 4.5
Explanation of complex NBI patterns in columnar epithelial mucosa (right side; colon) and adenoma (left side) (Adapted from Tanaka et al. [26], permission granted by John Wiley & Sons Inc.). Magnifying colonoscopic images of normal mucosa (right) and tubulovillous adenoma (left, top: indigo carmine CE; left, bottom: NBI). The “white zone” (WZ) on NBI image represents the perpendicularly illuminated layers of marginal crypt epithelium of glandular pits (the microvascular pattern is extinct) which is the entire pitlike structure (right panel). An actual pit is hardly observed as dark dot, because perpendicular illumination of the gland pit is rarely achieved. The CP of normal colonic LPM is regular and brownish on NBI (right lower panel)
Colonic mucosa exhibits a regular surface pattern of pits on magnifying NBI and indigo carmine CE (explained in Fig. 4.5) that differs from adenoma.
4.6.1 Microarchitecture of Colonic Neoplasias
Adenomas in gastrointestinal tract are defined on histology by cylinder epithelial cells with enhanced proliferation, even structure of pseudoglands, and noninvasive growth pattern (Fig. 4.6a, b). These clonal epithelial neoplasms form different macroscopic types, e.g., flat types 0–IIb and 0–IIc or flat protruding types 0–IIa that can also grow to sessile or polypoid adenoma or expansively spread out to larger-size, flat or flat-elevated, laterally spreading-type neoplasias (LST, in colon).
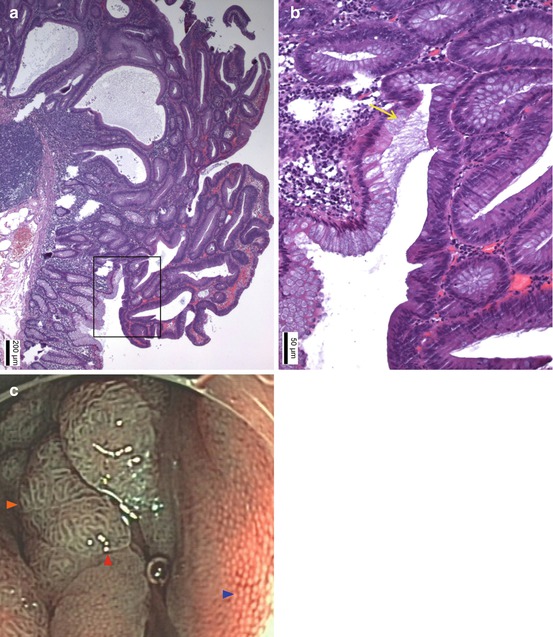

Fig. 4.6


(a) Classical tubular adenoma in colon exhibits noninvasive growth pattern of regular tubular glands. Coherent expansive growth of transformed epithelium creates pseudoglands with single-layered surface epithelium (even WZ) and may lead to protruding mucosal neoplasia 0–IIa or Isp (HE stain). (b) Insert from a, magnified: yellow arrow (→) sharp transition with even surface (clear margin, even surface) from colonic epithelium (left side) to adenomatous colonocytes (right side) which show enhanced nucleus/cytoplasm ratio, loss of basal polar orientation, and clonal proliferation without goblet cells (Courtesy Dr. Daniel Neureiter). (c) Magnifying NBI (80×) reveals normal colonic mucosa (right side,  ) with round dots of white zone, (WZ = marginal crypt epithelium) representing dot-like openings of tubular glands and a fine brownish network of capillaries around glands in LPM. Top and left sides (
 ) show flat protruding adenoma (0–IIa) with large tubular surface structure displaying even bands of WZ and ridgelike bands of brownish CP in LPM of adenomatous pseudogland tubule. Adenoma has a clear sharp margin (
 ) to columnar mucosa
 ) with round dots of white zone, (WZ = marginal crypt epithelium) representing dot-like openings of tubular glands and a fine brownish network of capillaries around glands in LPM. Top and left sides (
 ) show flat protruding adenoma (0–IIa) with large tubular surface structure displaying even bands of WZ and ridgelike bands of brownish CP in LPM of adenomatous pseudogland tubule. Adenoma has a clear sharp margin (
 ) to columnar mucosa
Stay updated, free articles. Join our Telegram channel

Full access? Get Clinical Tree


