Time
Rat 1
Rat 2
Rat 3
Rat 4
Rat 5
Mean; SD (8 h)
Urine volume
(8 h)
ml
Urine volume
(24 h)
ml
Urine volume
(8 h)
ml
Urine volume
(24 h)
ml
Urine volume
(8 h)
ml
Urine volume
(24 h)
ml
Urine volume
(8 h)
ml
Urine volume
(24 h)
ml
Urine volume
(8 h)
ml
Urine volume
(24 h)
ml
Furosemide
Before
3.6
37.7
2.8
11.4
3.7
10.0
3.0
11.5
3.3
8.5
3.2; 0.3
Day 1*
7.7
38.7
3.6
15.6
9.2
22.2
6.5
27.5
5.0
13.0
6.4; 2.2
Day 3*
7.2
42.2
2.5
10.0
8.0
20.6
6.2
30.0
7.2
14.5
6.2; 2.2
Day 5*
10.0
21.5
8.0
13.5
9.0
14.0
13.3
21.3
5.5
8.5
9.2; 2.8
Hydrochlorothiazide
Before
5.5
12.5
6.1
30.0
5.3
11.0
4.9
15.5
4.7
12.5
5.3; 0.5
Day 1*
12.0
27.5
13.4
34.9
12.0
28.2
9.5
19.7
10.5
23.0
11.5; 1.5
Day 3*
9.3
19.3
12.0
38.0
11.3
25.0
5.3
15.3
15.5
23.5
10.7; 3.7
Day 5*
16.0
27.0
12.5
21.0
10.5
20.5
11.0
17.0
12.0
18.0
12.4; 2.2
Spirolactone
Before
–
27.5
–
15.5
–
27.5
–
17.5
–
14.2
–
Day 1**
–
36.0
–
18.5
–
28.0
–
18.0
–
16.0
–
Day 3**
–
23.0
–
15.5
–
27.0
–
17.4
–
21.0
–
Day 5**
–
25.0
–
17.0
–
29.5
–
19.0
–
20.5
–
As a first step of the sample analysis, the urine samples collected on different days were separated by SDS-PAGE. As shown in Fig. 13.1a, the protein patterns of the urine samples in the H group changed only modestly among those obtained before and 1, 3, and 5 days after the diuretics administration. However, for the F and S groups, there were some significant changes among samples obtained at different time points, especially those on Day 3 after gavage for the F group (Fig. 13.1b) and Day 1 for the S group (Fig. 13.1c). Therefore, normal urine samples, Day 3 for the F and H groups and Day 1 for the S group, were further analyzed using 1D-LC-MS/MS.


Fig. 13.1
SDS-PAGE of the urine samples from rats treated by different diuretics [16]. Urine protein samples were separated by SDS-PAGE and stained using Commassie blue brilliant for the hydrochlorothiazide group (H, a), the furosemide group (F, b), and the spirolactone group (S, c), M markers; B normal rat urine samples; A1, A3, and A5 urine samples obtained 1, 3, and 5 days after the diuretics were administered
To investigate the changes of the urine proteome after diuretics administration, a total of 18 LC-MS/MS runs of urine samples from three different rats in each diuretic group were analyzed. The 18 datasets were analyzed using Progenesis LC-MS, and Mascot Daemon. The false discovery rate (FDR) was adjusted to be less than 1 %. As a result, there were 331, 302, and 325 proteins identified in the F, S, and H group, respectively.
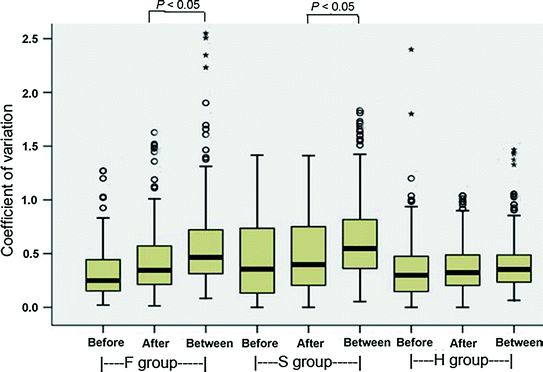
The coefficients of variation (CVs) for each of the three levels of sample variation before gavage, after gavage, and between these two conditions were calculated. As shown in Fig. 13.2, the CV values of the samples after gavage were slightly higher than those before gavage (median CV values: F group 0.25 vs. 0.34; S group 0.35 vs. 0.39; H group 0.28 vs. 0.31), possibly maybe because rats respond differentially to the diuretics. In contrast, the CV values of the samples for between before and after gavage and for after gavage (median CV of F group is 0.45; median CV of S group is 0.55) are significantly higher (P < 0.05), suggesting that furosemide and spirolactone can change the urine proteome. However, the CV values of H-diuretics (median CV is 0.33) were not changed significantly, indicating that hydrochlorothiazide has no discernible effects on the rat urine proteome at this dosage.
The CV values of proteins identified in each group before diuretics administration, after and between these two states, were calculated using SPSS 13.0. Before indicates the CV values of urine samples before diuretics administration in the F, S, and H group, respectively; after indicates the CV values of urine samples after diuretics administration in each group; between indicates the CV values of urine samples between before and after diuretics administration in each group (n = 3; in F and S group, P < 0.05).
Using the label-free quantification by the Progenesis LC-MS software, we identified seven (five upregulated and two downregulated), five (one upregulated and four downregulated), and two (one upregulated and one downregulated) proteins which significantly changed in all three rats in the F, S, and H group, respectively, according to the criteria: P ≤ 0.05, a fold change ≥2 and a spectral count ≥5. As shown in Tables 13.2 and 13.3, five of the seven proteins in the F group and all of the five proteins in the S group have been reported to be disease biomarkers. For example, haptoglobin is a candidate biomarker for patients with bladder cancers, acute kidney injury, or diabetic nephropathy. However, neither of the two significantly changed proteins (beta-microseminoprotein and EGF-containing fibulin-like extracellular matrix protein 1) has been reported as biomarkers in hydrochlorothiazide group. Moreover, hydrochlorothiazide appears to have a lower impact than furosemide and spirolactone at the dosages tested. Interestingly, no significantly changed proteins are shared by any two groups, indicating the distinct effects of the diuretics on the urinary proteome.
Table 13.2


Urinary proteins significantly changed after intragastric administration of furosemide [16]
Stay updated, free articles. Join our Telegram channel

Full access? Get Clinical Tree


