Fig. 16.1
Dynamic changes in ADR-treated rats. Urinary protein to creatinine ratios in six phases of ADR-treated rats. The data are expressed as the mean ± standard deviation (n = 13, * p < 0.05 for Experiment vs. Control). The paired t test was used to assess the significance of the differences between groups [10]
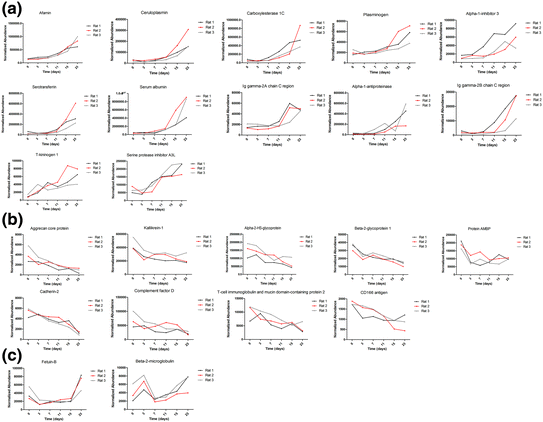
By label-free quantitative and statistical analyses, 23 proteins met the following conditions: (1) compared with day 0, max fold change >2 in each rat and (2) p value < 0.05. Among the 23 changed proteins, 20 proteins were annotated as glycoproteins in the UniProt database, 12 proteins shared an overall increasing trend in relative abundance, and 9 proteins shared an overall decreasing trend. Three trends were observed in these candidate biomarkers during ADR-induced nephropathy progression. The first was a gradual increase, with examples including afamin and ceruloplasmin. The second was a gradual decrease, with examples including cadherin-2 and aggrecan core protein. The third, which includes fetuin-B and beta-2-microglobulin, was early changes with distinct patterns. The time-dependent changes of 23 representative proteins from three rats are shown in Fig. 16.2.


Fig. 16.2
Expression of candidate urine biomarkers of ADR-induced nephropathy during six stages. The x axis represents different stages; the y axis represents the normalized abundance identified by the LC-MS Progenesis software [10]
At the early stage, such as days 3 and 7 after the ADR injection, proteinuria was not obvious. However, several proteins, such as fetuin-B, AMBP, and kallikrein-1, were decreased during this phase. These proteins may be good candidates for the early detection.
Candidate biomarkers demonstrated in animal models are more valuable if they can be confirmed in humans. The changed proteins were converted to their corresponding human orthologs using Ensembl Gene ID(s) by Ensembl BioMart (http://asia.ensembl.org/biomart/martview) as described [6, 7]. Of 23 identified changed proteins, 20 have human orthologs, including the seven validated by Western blot analysis. A previous study compared the kidney input (plasma) and output (urine) proteomes and divided urinary proteins into 3 categories, the plasma-only subproteome, the plasma-and-urine subproteome, and the urine-only subproteome [8]. To further analyze the functions of these candidate biomarkers, these changed proteins were compared with the human plasma proteome, human urine proteome, and kidney origin proteome. The human proteome data were downloaded from the Healthy Human Individual’s Integrated Plasma Proteome (HIP2) [7, 9], the human urine proteome data were acquired from previous studies [11–13], and the kidney origin proteome data were acquired from a kidney perfusion study [7]. The human orthologs of the changed proteins and their relationships with the human plasma, urine, and kidney origin proteomes are shown in Table 16.1. Most changed proteins exist in the normal human plasma proteome (17/20) and urine proteome (18/20); however, the CD166 antigen was detected only in the plasma proteome, kallikrein-1 was detected only in the normal urine proteome, and 10 proteins were detected in the kidney origin proteome. In addition, the urinary proteome is largely affected by individual factors, but biomarkers should be applicable to most people, in other words, changes in the stable contents of the healthy human urinary proteome are more likely to become biomarkers [26]. A total of 560 proteins were considered stable in healthy human urine [27]. Thirteen out of twenty candidate biomarkers in this study could be found among the stable proteins, indicating that these candidate biomarkers were more useful for clinical diagnoses as they are not affected by individual differences and are not time dependent.
Table 16.1
Comparison of human orthologs of candidate biomarkers with the normal human urine proteome, plasma proteome, and kidney origin proteome [10]
Corresponding human protein ID | Protein name | Plasma proteome | Urine proteome | Kidney origin proteome | Stable protein | Candidate biomarkers |
|---|---|---|---|---|---|---|
P01009 | Alpha-1-antiproteinase | Yes | Yes | Yes | Yes | FSGS [14] |
P43652 | Afamin | Yes | Yes | Yes | Yes | Diabetic nephropathy [15] |
P02768 | Serum albumin | Yes | Yes | Yes | Yes | Adriamycin nephropathy mice model [16] |
P00450 | Ceruloplasmin | Yes | Yes | Yes | Yes | Diabetic nephropathy [17] |
P01042 | Kininogen-1 | Yes | Yes | Yes | Yes | Adriamycin nephropathy rat model [18] |
P02787 | Serotransferrin | Yes | Yes | Yes | Yes | Adriamycin nephropathy mice model [16] |
P23141 | Carboxylesterase 1 | Yes | Yes | No | No | None |
P01861 | Ig gamma-4 chain C region
Stay updated, free articles. Join our Telegram channel
Full access? Get Clinical Tree
 Get Clinical Tree app for offline access

|


