Differential Diagnoses for Abdominal and Pelvic Magnetic Resonance Imaging
Successful implementation of abdominal and pelvic magnetic resonance imaging (MRI) consists of the following steps: creation of high-quality images, detection of significant abnormalities, and development of a meaningful differential diagnosis. This section concentrates on the third step-development of a meaningful differential diagnosis. The lists of differential diagnoses that follow reflect commonly encountered or particularly challenging clinical scenarios. With each entity listed, one or more brief differentiating features are provided to assist in narrowing the differential diagnosis. Also included are lists that are not differential diagnoses per se, but rather provide concise information on related clinical entities (e.g., syndromes). Not listed are some very rare entities and highly unusual manifestations of more common diseases. Therefore, the information presented here cannot be considered a substitute for a thorough search of the imaging literature.
Pseudotumors of the Abdomen and Pelvis
Focal fat and fatty sparing—Focal fatty infiltration is common in the liver and may mimic a focal mass (see Fig. 3.18). Multifocal fatty infiltration may simulate hepatic metastases. Focal fatty sparing in an otherwise diffusely fatty infiltrated liver may also appear round and masslike (Fig. 3.115). Focal fat may also mimic a mass in the pancreas (Fig. 3.116). These entities are readily characterized on in-phase and opposed-phase imaging (the fatty areas lose signal on opposed-phase images). Contrast enhancement of infiltrated areas usually parallels that of normal parenchyma. Some tumors also contain intracellular lipid and may simulate focal fat.
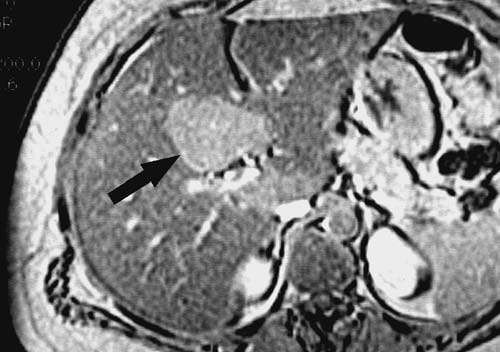 FIG. 3.115. Focal fatty sparing. Gadolinium-enhanced opposed-phase gradient echo image demonstrates masslike area of focal fatty sparing (arrow) in central portion of liver. Liver was homogeneous on all other sequences (not shown). |
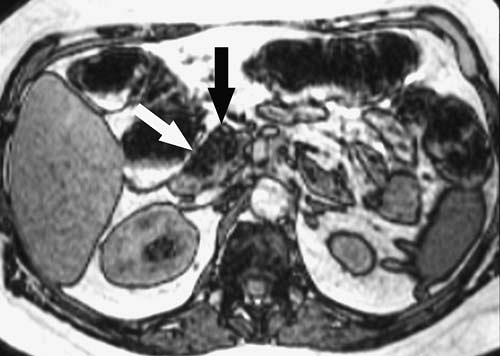 FIG. 3.116. Focal fatty infiltration of pancreas. T1-weighted opposed-phase gradient echo image shows focal area of low signal intensity (arrows) in region of pancreatic head caused by focal fat infiltration. This area was normal on all other sequences, including the in-phase image (not shown). Bile duct and pancreatic duct were normal. |
Transient hepatic intensity difference (THID)—Increased enhancement of a hepatic segment or lobe during the arterial phase of enhancement. This enhancement usually fades to approach that of normal liver on portal venous and equilibrium phase images. THID is caused by a regional reduction of portal flow with compensatory increased arterial flow to the involved segment or lobe. THID is often seen in the absence of any identifiable cause but should prompt careful scrutiny of the images for associated tumor or vascular abnormality.
Duodenal diverticulum (Fig 3.117)—Common cause of pancreatic head pseudotumor. The presence of air or an air-fluid level within the lesion and continuity with the duodenal lumen are helpful differentiating features.
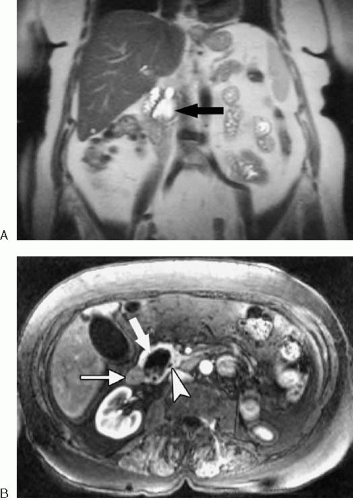 FIG. 3.117. Duodenal diverticulum simulating pancreatic mass. A: Coronal HASTE image shows apparent cystic mass (arrow) in region of pancreatic head. B: Fat-suppressed, gadolinium-enhanced gradient echo image shows duodenal diverticulum in same patient as (A) simulating cystic pancreatic head mass between duodenum (thin arrow) and pancreatic duct (arrowhead). |
Gastric diverticulum (Fig 3.118)—Common cause of adrenal pseudotumor. The presence of air within the lesion or continuity with the gastric fundus should suggest this entity.
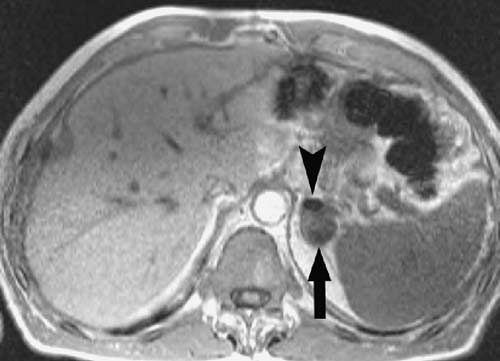 FIG. 3.118. Gastric diverticulum simulating adrenal mass. T1-weighted spoiled gradient echo image shows mass (arrow) in expected location of left adrenal gland. Clue to correct diagnosis of gastric diverticulum is susceptibility artifact caused by air (arrowhead) in nondependent portion of mass. |
Varices (Fig. 3.119)—Common cause of adrenal, gastric, or esophageal pseudotumor. Varices occur in the setting of portal hypertension, are tubular, and parallel the veins in signal intensity after intravenous gadolinium administration.
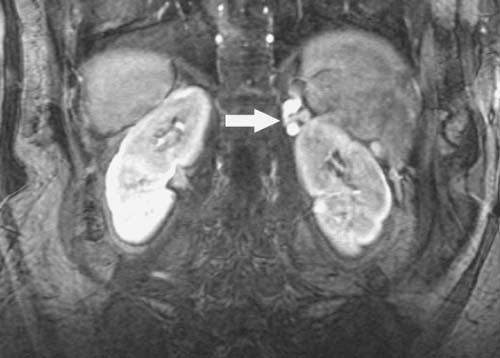 FIG. 3.119. Varices simulating adrenal mass. Coronal fat-suppressed, gadolinium-enhanced T1-weighted image shows enhancing suprarenal varices (arrow) that might be mistaken for adrenal mass on other sequences. |
Plane-dependent adrenal pseudotumor (Fig. 3.120)—Imaging through the broad, flat portion of a normal adrenal gland may create the appearance of a mass lesion.
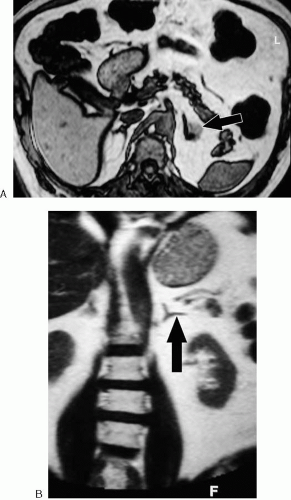 FIG. 3.120. Plane-dependent pseudotumor of adrenal gland. A: Axial opposed-phase gradient echo image through abdomen shows apparent mass (arrow) of left adrenal gland caused by partial volume effect. B: Coronal image through left adrenal gland shows no evidence of mass. |
Accessory spleen (Fig. 3.121)—Accessory spleens, or splenules, may mimic adrenal, pancreatic, or peritoneal tumors. Accessory splenic tissue parallels normal spleen on unenhanced and contrast-enhanced MR images. Splenules show decreased signal on T2- and T2*-weighted images after ferumoxides administration due to the presence of reticuloendothelial system cells.
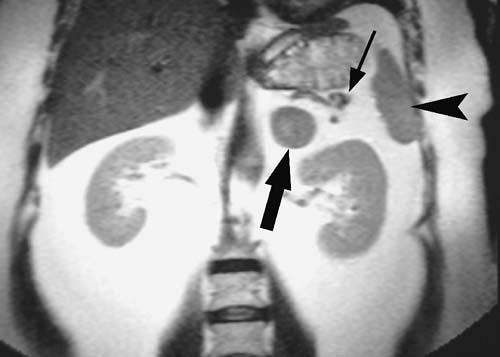 FIG. 3.121. Accessory spleen simulating adrenal mass. Left suprarenal mass (arrow) followed signal intensity of spleen (arrowhead) on all sequences. Diagnosis of accessory spleen was suggested by MRI, but biopsy was performed, revealing only blood and lymphocytes. Question mark (thin arrow) was coincidental but appropriate. |
Phase ghost (Figs. 3.122, 3.123)—Common cause of liver (usually left lateral lobe), pancreatic, and vertebral pseudotumor. Occurs in the phase-encoding direction of the image and lines up with offending structure (e.g., aorta). Multiple ghosts of alternating high and low signal intensity should be sought. The appearance of phase ghosts is usually sufficiently typical to exclude a true lesion. Rarely, a true lesion of the left hepatic lobe may appear similar to a phase ghost from the aorta (see Fig. 3.123). The absence of additional ghosts elsewhere in the plane of the aorta should arouse suspicion. Swapping the phase and frequency directions on a repeat scan confirms the nature of the lesion (a true lesion persists in the same location).
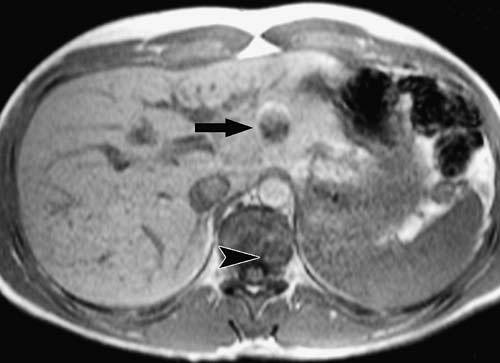 FIG. 3.122. Phase ghost simulating hepatic mass. Round, low signal intensity lesion (arrow) in left hepatic lobe is actually ghost produced by aorta. A similar but fainter ghost is seen over spine (arrowhead). |
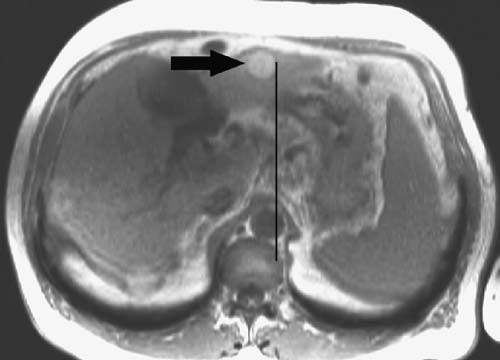 FIG. 3.123. Liver nodule simulating phase ghost. T1-weighted spoiled gradient echo image shows high signal intensity cirrhotic nodule (arrow) in left hepatic lobe that resembles a phase ghost from aorta. Note, however, that nodule does not exactly align with aorta (black line). |
Fat- or Lipid-Containing Lesions of the Abdomen and Pelvis
Adrenal adenoma (see Fig. 3.63)—Intracellular lipid is best demonstrated on in-phase and opposed-phase images.
Adrenal cortical carcinoma—Lipid-rich cells may be present, but the large and often necrotic appearance of the majority of these tumors makes confusion with benign adenoma unlikely.
Adrenal myelolipoma (see Fig. 3.66)—Usually a predominantly fatty mass with areas of myeloid elements. Predominantly fatty tumors are well demonstrated with fat saturation, whereas opposed-phase imaging may be useful when similar amounts of fat and myeloid elements are intermixed.
Renal angiomyolipoma (see Figs. 3.3, 3.68)—Small lesions are well demonstrated on in-phase and opposed-phase images, whereas larger lesions with prominent areas of fat are best demonstrated with standard fat suppression techniques (e.g., fat saturation, short tau inversion recovery [STIR], spectral presaturation inversion recovery [SPIR]).
Benign cystic teratoma (see Figs. 3.92, 3.93)—This adnexal mass is best characterized with standard fat suppression techniques (fat saturation, STIR, SPIR).
Clear cell carcinoma of kidney (Fig 3.124)—A small percentage of these tumors contain significant concentrations of intracellular lipid, which can be demonstrated on in-phase and opposed-phase images. Care should be taken not to confuse these lesions with angiomyolipomas. Although macroscopic fatty elements are exceedingly uncommon in
renal cell carcinoma, tumors may rarely engulf renal sinus fat.
renal cell carcinoma, tumors may rarely engulf renal sinus fat.
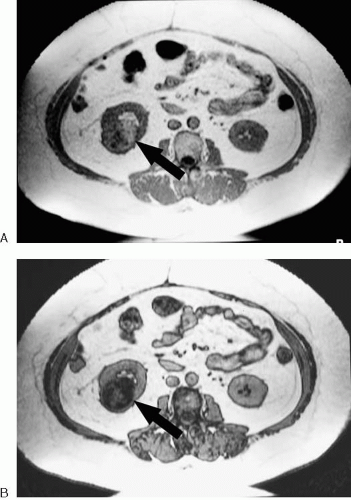 FIG. 3.124. Lipid-containing clear cell carcinoma of kidney. Axial in-phase gradient echo image (A) shows mass of right kidney to contain high signal intensity elements (arrow) that lose signal intensity on opposed-phase image (B). |
Focal nodular hyperplasia (FNH) (Fig. 3.125)—A rare manifestation of FNH, intracellular lipid is best demonstrated with in-phase and opposed-phase imaging.
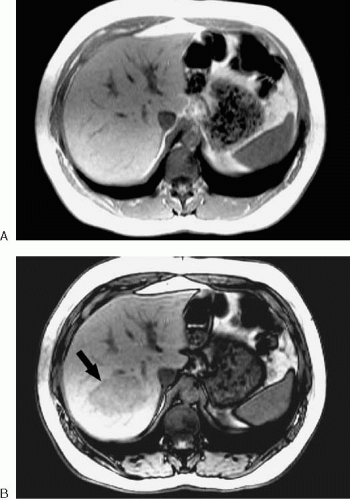 FIG. 3.125. Lipid-containing focal nodular hyperplasia (FNH). A: In-phase T1-weighted gradient echo image of liver shows homogeneous signal intensity of liver. B: Opposed-phase image performed as part of same sequence as (A) shows area of signal loss (arrow) in right hepatic lobe corresponding to surgically confirmed FNH. |
Hepatic adenoma (see Fig. 3.6)—Intracellular lipid is common within this entity and best demonstrated with in-phase and opposed-phase imaging.
Hepatocellular carcinoma (Fig 3.126)—Intracellular lipid is best demonstrated with in-phase and opposed-phase imaging.
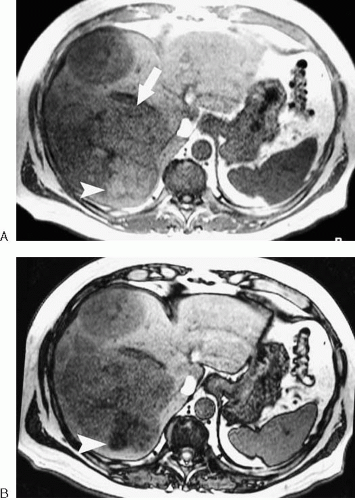 FIG. 3.126. Lipid-containing hepatocellular carcinoma. A: In-phase T1-weighted gradient echo image of large hepatic mass (arrow) shows area of slightly higher signal intensity (arrowhead) posteriorly. B: Opposed-phase image performed as part of same sequence as (A) shows focal area of signal loss (arrowhead) consistent with intracytoplasmic lipid. |
Lipoma—Occurs throughout the body, most often in or adjacent to muscles or normal fatty deposits. Can also occur within bones and solid parenchymal organs such as the liver and pancreas. Composed almost entirely of fat, lipomas are best characterized by acquiring a T1-weighted sequence of the area of interest with and without frequency-selective fat saturation.
Lipoleiomyoma—Rare benign tumor that may occur in the uterus or ovary. Uterine lipoleiomyoma may be associated with ordinary leiomyomas.
Liposarcoma—Well-differentiated liposarcoma may be difficult to distinguish from benign lipoma. Alternatively, liposarcoma may contain relatively little fat. Larger areas of fat are well demonstrated by scanning with and without standard fat suppression techniques. Enhancing soft tissue elements within a fatty mass favor liposarcoma over lipoma.
Malignant ovarian teratoma—Enhancing soft tissue elements and invasion of adjacent structures suggests malignant nature of this mass.
Selected Syndromes and Multisystem Abnormalities Affecting the Abdomen and Pelvis
Multiple endocrine neoplasia (MEN)—Autosomal dominant neoplastic abnormality predominantly affecting the endocrine system.
MEN I (Wermer)—Abdominal manifestations include pancreatic islet cell tumors, which are more likely to be malignant and multiple than sporadic cases. Gastrinoma is a common tumor type in the setting of MEN (Fig. 3.127). Other abnormalities include pituitary and parathyroid adenoma.
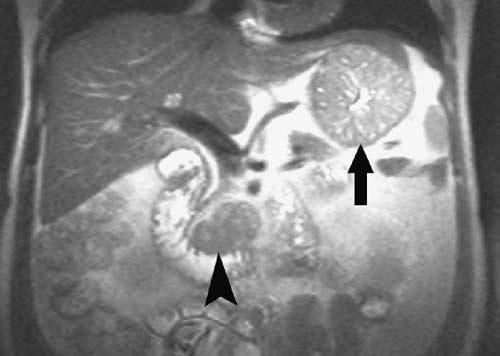 FIG. 3.127. Gastrinoma in multiple endocrine neoplasia I syndrome. Coronal HASTE image demonstrates marked rugal fold thickening in the stomach (arrow) due to gastrinoma near pancreatic head (arrowhead). |
MEN IIa (Sipple)—Primary abdominal manifestation is pheochromocytoma (Fig. 3.128), which has a high incidence of bilaterality in these patients. Other manifestations include parathyroid adenoma and medullary carcinoma of the thyroid.
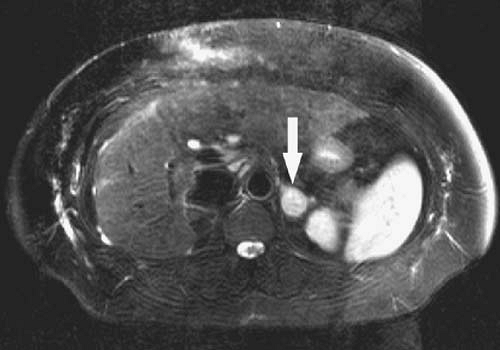 FIG. 3.128. Pheochromocytoma in multiple endocrine neoplasia IIa syndrome. Axial fat-suppressed T2-weighted image shows high signal intensity left adrenal pheochromocytoma (arrow). |
MEN IIb (III, mucosal neuroma syndrome)—Also associated with pheochromocytoma. The other primary abdominal manifestation of MEN IIb is intestinal neuromas. Also associated with mucosal neuromas elsewhere and medullary carcinoma of the thyroid.
Von Hippel-Lindau disease (VHL) (Fig. 3.129)—Autosomal dominant neurocutaneous syndrome. Abdominal and
pelvic manifestations include pheochromocytomas, pancreatic islet cell tumors, pancreatic cysts, pancreatic serous cystadenomas, renal cysts, renal cell carcinomas, papillary cystadenoma of the epididymis, and ovarian cysts. Pancreatic and renal cysts tend to be multiple and may be extensive. VHL can be distinguished from autosomal dominant polycystic kidney disease by the extensive pancreatic involvement (Fig. 3.130). Renal cell carcinoma is common in patients with VHL and bilateral or multiple tumors are often present. These malignant renal tumors may appear cystic and be difficult to differentiate from the multiple other benign renal cysts. Other manifestations include central nervous system (CNS) hemangioblastoma and retinal angioma.
pelvic manifestations include pheochromocytomas, pancreatic islet cell tumors, pancreatic cysts, pancreatic serous cystadenomas, renal cysts, renal cell carcinomas, papillary cystadenoma of the epididymis, and ovarian cysts. Pancreatic and renal cysts tend to be multiple and may be extensive. VHL can be distinguished from autosomal dominant polycystic kidney disease by the extensive pancreatic involvement (Fig. 3.130). Renal cell carcinoma is common in patients with VHL and bilateral or multiple tumors are often present. These malignant renal tumors may appear cystic and be difficult to differentiate from the multiple other benign renal cysts. Other manifestations include central nervous system (CNS) hemangioblastoma and retinal angioma.
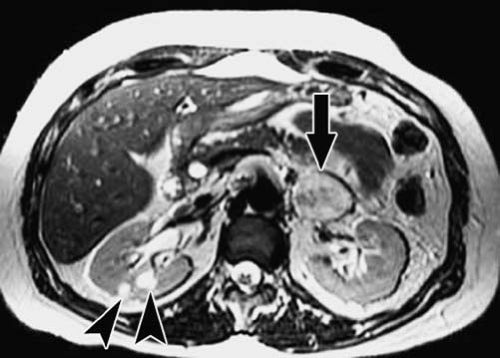 FIG. 3.129. Von Hippel-Lindau disease. Axial T2-weighted image of the abdomen shows large high signal intensity left adrenal mass (arrow) and small right renal cysts (arrowheads). At surgery, bilateral pheochromocytomas and islet cell tumor of pancreas were removed. Bilateral cystic renal cell carcinomas were also present, but could not be identified as malignant by imaging. |
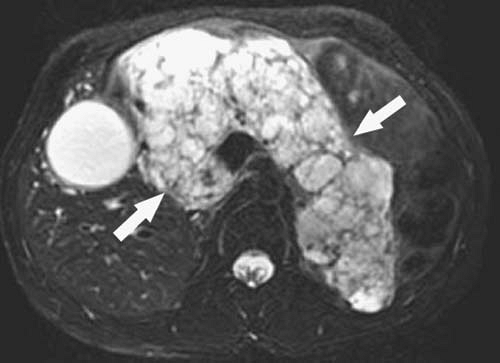 FIG. 3.130. Von Hippel-Lindau disease. Axial fat-suppressed T2-weighted image of pancreas (arrows) demonstrates extensive pancreatic cysts. |
Tuberous sclerosis (Bourneville disease)—Autosomal dominant neurocutaneous syndrome characterized by some combination of adenoma sebaceum, seizures, and mental retardation. Abdominal manifestations include multiple renal cysts and angiomyolipomas (see Fig. 3.68). Renal involvement with cysts may be extensive. Angiomyolipomas are often multiple, may grow over time, and are prone to hemorrhage. Angiomyolipomas may also occur in the liver. Extraabdominal manifestations include cardiac rhabdomyomas.
Neurofibromatosis type 1 (Von Recklinghausen disease)—Autosomal dominant disorder characterized by peripheral neurofibromas and café-au-lait spots. Abdominal manifestations include neurofibromas, neurofibrosarcoma, and pheochromocytoma (Fig. 3.131). Neurofibromas tend to have very high signal intensity on T2-weighted images. Neurofibromatosis type 1 has also been associated with gastrointestinal (GI) stromal tumors and somatostatinomas. Neurofibromas may also occur within the GI tract.
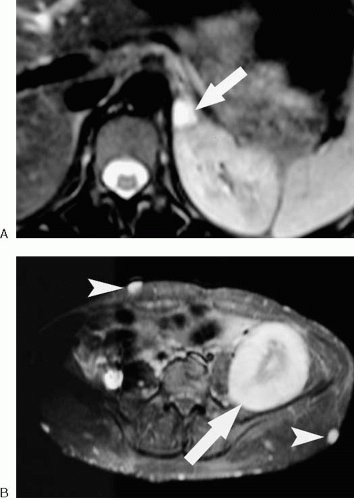 FIG. 3.131. Neurofibromatosis. A: Fat-suppressed T2-weighted image shows small high signal intensity left adrenal pheochromocytoma (arrow) in patient with NF-1. B: Lower image from same patient demonstrates a large plexiform neurofibroma (arrow) and multiple cutaneous neuromas (arrowheads). |
Autosomal dominant polycystic kidney disease—A genetic disorder of very high penetrance but variable expression. Named for the typical extensive renal cystic involvement (Fig. 3.132), this disorder is also associated with cysts of the liver and other viscera such as the spleen and pancreas. Liver involvement may exceed that of the kidneys. Pancreatic cysts are rare and involvement is typically not as extensive as may be seen with VHL disease. Cysts are often of variable signal intensity on T1- and T2-weighted images due to hemorrhage. Also associated are saccular cerebral aneurysms.
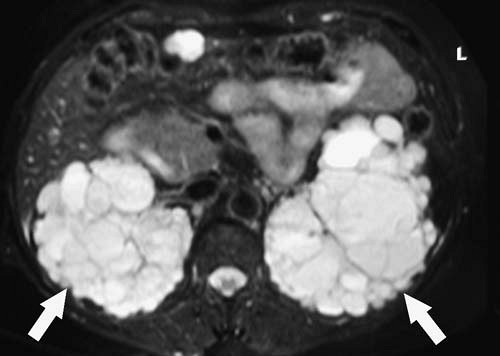 FIG. 3.132. Autosomal dominant polycystic kidney disease. Fat-suppressed T2-weighted image demonstrates extensive bilateral renal involvement with cysts (arrows). |
Hereditary hemorrhagic telangiectasia (Osler-Weber-Rendu syndrome) (Figs. 3.133, 3.134)—Hereditary vascular disorder resulting in multiple telangiectasias and arteriovenous malformations in various organs, including the GI tract, liver, lungs, skin, and CNS. Vascular malformations of the bowel are often not visible with MRI. However, involvement
of the liver by multiple arteriovenous malformations (AVMs) may be well demonstrated. As a result of the arteriovenous shunting in the liver, the hepatic artery may become quite large.
of the liver by multiple arteriovenous malformations (AVMs) may be well demonstrated. As a result of the arteriovenous shunting in the liver, the hepatic artery may become quite large.
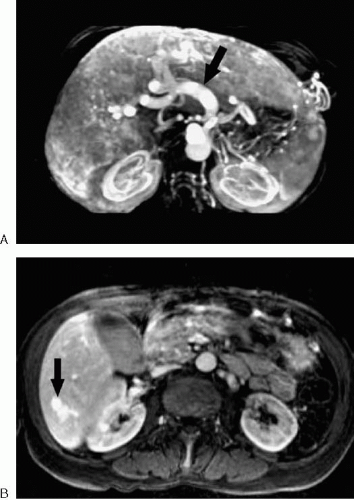 FIG. 3.133. Hereditary hemorrhagic telangiectasia (HHT). A: Maximum intensity projection of arterial phase three-dimensional gradient echo sequence shows massively enlarged hepatic artery (arrow) in patient with HHT. B: Vascular malformation is present in right hepatic lobe of different patient with HHT (arrow). |
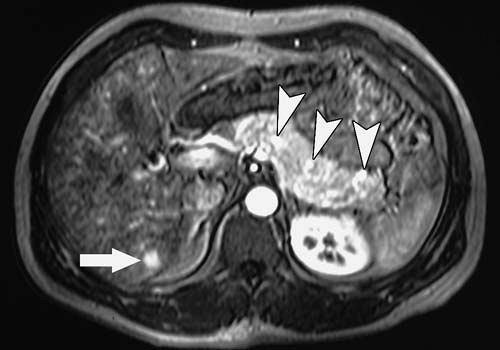 FIG. 3.134. Hereditary hemorrhagic telangiectasia (HHT). Axial gadolinium-enhanced three-dimensional gradient echo image through abdomen of patient with HHT shows multiple pancreatic (arrowheads) and hepatic (arrow) vascular malformations. |
Mayer-Rokitansky-Küster-Hauser syndrome (Fig. 3.135)—This syndrome occurs when the müllerian ducts fail to develop, resulting in variable degrees of agenesis or hypoplasia of the uterus and vagina. The diagnosis is readily made with MRI when an absent or rudimentary uterus is noted in the presence of intact ovaries in a patient with no surgical history. Skeletal and renal anomalies (renal agenesis or malposition) may be present.
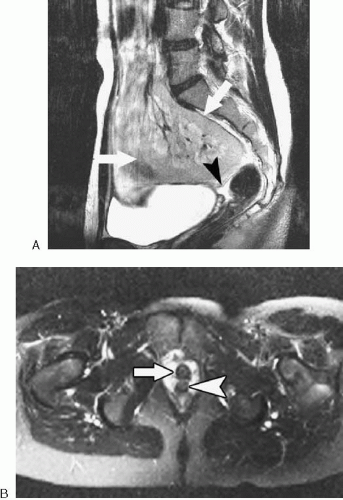 FIG. 3.135. Mayer-Rokitansky-Küster-Hauser syndrome. A: Sagittal T2-weighted image through pelvis of female patient with amenorrhea reveals absence of uterus with only small amount of fluid occupying space between bladder and rectum (arrowhead). Solitary pelvic kidney (arrows) is noted. B: Axial fat-suppressed T2-weighted image through lower pelvis in same patient as (A) shows normal urethra (arrow) surrounded by high signal intensity periurethral veins. Vagina (arrowhead) lacks normal “H” shape. |
Disorders of Iron Metabolism and Deposition
Primary (idiopathic) hemochromatosis—Autosomal recessive disorder resulting in increased intestinal absorption of
iron. Excess iron accumulates, not in the reticuloendothelial system, but in the hepatocytes and parenchymal cells of a variety of other organs such as the pancreas, pituitary gland, heart, joints, and skin (Fig. 3.136). Excess iron is well demonstrated on T2- and T2*-weighted images. Hepatic iron eventually leads to cirrhosis, and patients are at markedly increased risk for hepatocellular carcinoma. Pancreatic involvement may lead to diabetes. It is important to distinguish primary hemochromatosis from transfusional hemochromatosis, because the former condition is potentially lethal and can be treated with phlebotomy or chelation if detected at an early stage. An abnormally dark liver on T2- or T2*-weighted images associated with normal splenic signal intensity should arouse suspicion for primary hemochromatosis. Abnormal darkening of the pancreas further supports this diagnosis, although histologic confirmation via liver biopsy is usually necessary. Rarely, reduced myocardial signal intensity is also seen in patients with primary hemochromatosis.
iron. Excess iron accumulates, not in the reticuloendothelial system, but in the hepatocytes and parenchymal cells of a variety of other organs such as the pancreas, pituitary gland, heart, joints, and skin (Fig. 3.136). Excess iron is well demonstrated on T2- and T2*-weighted images. Hepatic iron eventually leads to cirrhosis, and patients are at markedly increased risk for hepatocellular carcinoma. Pancreatic involvement may lead to diabetes. It is important to distinguish primary hemochromatosis from transfusional hemochromatosis, because the former condition is potentially lethal and can be treated with phlebotomy or chelation if detected at an early stage. An abnormally dark liver on T2- or T2*-weighted images associated with normal splenic signal intensity should arouse suspicion for primary hemochromatosis. Abnormal darkening of the pancreas further supports this diagnosis, although histologic confirmation via liver biopsy is usually necessary. Rarely, reduced myocardial signal intensity is also seen in patients with primary hemochromatosis.
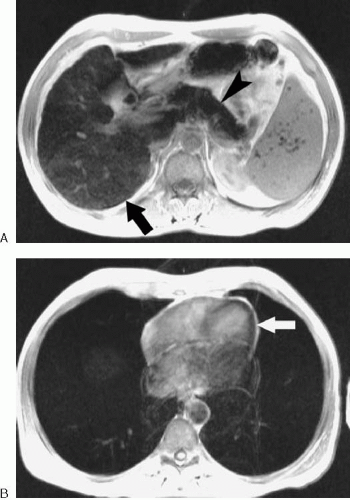 FIG. 3.136. Primary hemochromatosis. A: Axial in-phase T1-weighted gradient echo image demonstrates markedly diminished signal intensity in liver (arrow) and pancreas (arrowhead) due to parenchymal iron deposition. Liver is cirrhotic. B: Axial in-phase gradient echo image through lower chest of same patient as in (A) reveals decreased signal in left ventricular myocardium (arrow) consistent with iron deposition. |
Paroxysmal nocturnal hemoglobinuria (PNH)—Rare acquired hemolytic disorder resulting from an abnormal clone of hematopoietic stem cells susceptible to complement-mediated lysis. Intravascular hemolysis requiring multiple transfusions results in hemosiderosis. Iron is also deposited in the renal cortex, giving a characteristic appearance of decreased signal intensity on T2- and T2*-weighted images (Fig. 3.137). Because these patients are predisposed to vascular thromboses, a search should be performed for evidence of occlusion of the visualized abdominal and pelvic veins including the hepatic and portal veins.
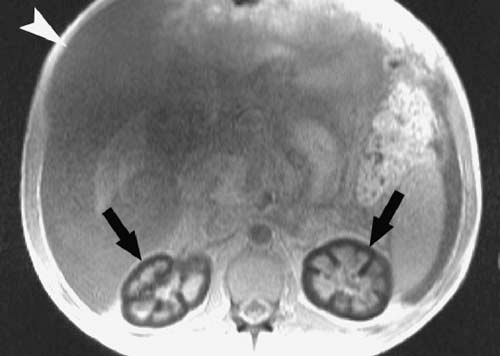 FIG. 3.137. Paroxysmal nocturnal hemoglobinuria (PNH). Axial in-phase T1-weighted gradient echo sequence demonstrates markedly diminished signal intensity in renal cortices (arrows) in patient with PNH. Patient also had hepatic and portal vein thrombosis. Note ascites (arrowhead). |
Hemolytic anemias and transfusional iron overload—Iron overload resulting from multiple blood transfusions can usually be distinguished from primary hemochromatosis, because in the case of multiple transfusions, the iron accumulates within the reticuloendothelial system. Therefore, the T2* effect of the excess iron is manifested initially in the liver and spleen, but not the pancreas. T2- and T2*-weighted images are more sensitive than T1-weighted images for detecting excess iron. With in-phase and opposed-phase imaging, excess iron usually creates the opposite effect from fatty infiltration of the liver, causing signal loss on the in-phase image. (The longer echo time [TE] of the in-phase image results in greater T2*-weighting). Once the excess iron exceeds the storage capacity of the reticuloendothelial system, parenchymal deposition of iron occurs. This may result in pancreatic signal loss similar to that seen with primary hemochromatosis.
The signal abnormalities in patients with hemolytic anemia are more complex and are influenced by the transfusional history and rate of intestinal iron absorption. Some patients
with hemolytic anemia have increased iron absorption without the need for blood transfusion. This may result in MRI findings similar to primary hemochromatosis. Patients with sickle cell disease or intravascular hemolysis from a prosthetic heart valve may demonstrate iron-related renal cortical signal loss identical to that seen with PNH (Fig. 3.138).
with hemolytic anemia have increased iron absorption without the need for blood transfusion. This may result in MRI findings similar to primary hemochromatosis. Patients with sickle cell disease or intravascular hemolysis from a prosthetic heart valve may demonstrate iron-related renal cortical signal loss identical to that seen with PNH (Fig. 3.138).
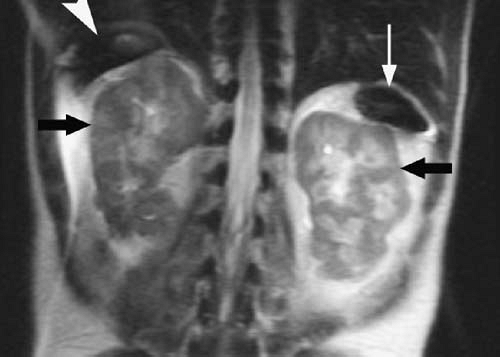 FIG. 3.138. Sickle cell anemia. Coronal HASTE image demonstrates decreased signal intensity of renal cortices bilaterally (arrows). Note decreased signal intensity of liver (arrowhead) and spleen (thin arrow). |
References: 9
Common Hernias
Bochdalek (Fig. 3.139)—Relatively common dorsolateral diaphragmatic hernia.
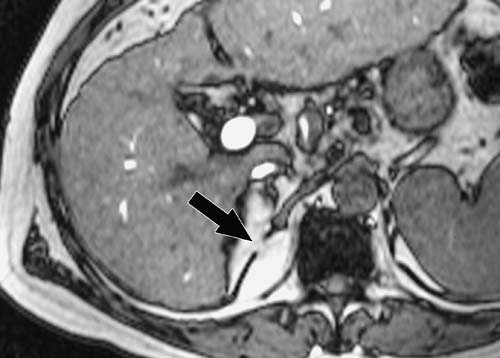 FIG. 3.139. Bochdalek hernia. Small posterior diaphragmatic defect is noted on right (arrow). Note nodular liver contour and hypertrophy of lateral segment of left hepatic lobe in patient with cirrhosis. |
Femoral—Herniation of peritoneal contents through the femoral ring into the femoral canal. Hernia sac may extend through saphenous opening. It is more common in women.
Hiatal (Fig. 3.140)—Gastric herniation through the esophageal hiatus. Gastroesophageal junction remains below the diaphragm in paraesophageal type and moves above the esophageal hiatus with the sliding variety. Sliding hiatal hernia is very common.
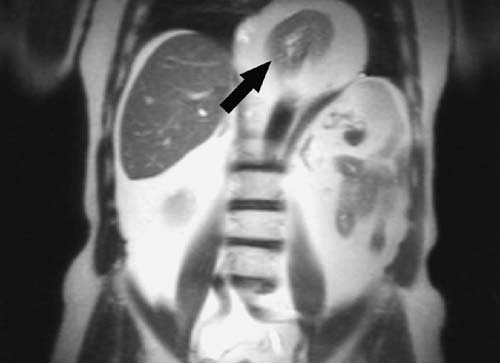 FIG. 3.140. Hiatal hernia. Coronal HASTE image shows herniation of stomach (arrow) and surrounding fat into mediastinum. |
Inguinal (see Fig. 3.99)—Herniation of peritoneal contents in the inguinal region. Indirect hernia occurs through internal inguinal ring into inguinal canal, coursing along the spermatic cord. Direct hernia (much less common) occurs medial to the deep (inferior) epigastric artery.
Incisional—Herniation of peritoneal contents through a surgically created abdominal wall defect.
Lumbar (Petit’s triangle hernia)—Protrusion of hernia sac in the region between the lowest rib and the iliac crest. Hernia
contents can include mesenteric or omental fat, bowel, and rarely kidney or spleen.
contents can include mesenteric or omental fat, bowel, and rarely kidney or spleen.
Parastomal—Protrusion of peritoneal contents through a defect created for an ostomy.
Spigelian—Lateral ventral hernia through a defect in the aponeurosis between the transversus abdominis and rectus abdominis muscles.
Richter—Protrusion of the antimesenteric wall of a bowel loop through a hernia ring resulting in focal strangulation.
Traumatic (Fig. 3.141)—History of significant blunt abdominal trauma. Associated hemorrhage may appear as high signal intensity on T1-weighted images.
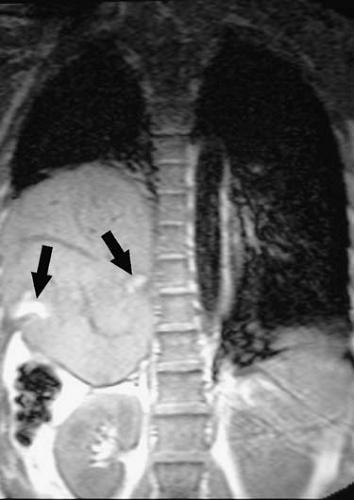 FIG. 3.141. Traumatic diaphragmatic hernia. Coronal T1-weighted gradient echo image shows cephalad displacement of liver into thorax through diaphragmatic defect. High signal intensity hemorrhage is present along rent in diaphragm (arrows). |
Umbilical (paraumbilical)—Protrusion of peritoneal contents through the anterior abdominal wall at the umbilicus.
References: 10
Cystic-Appearing Liver Lesion
Abscess (Fig. 3.142; see Figs. 3.2, 3.5)—Nonenhancing fluid collection with enhancing rim. Internal debris or gas may be present. Abscesses are often multiple.
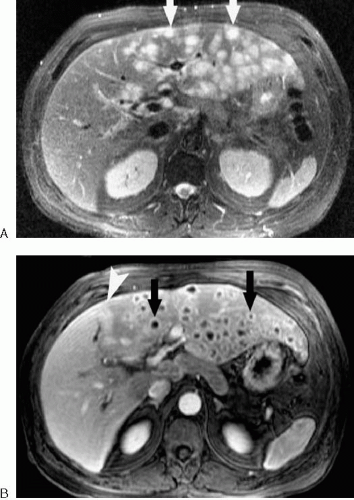 FIG. 3.142. Hepatic abscesses. A: Axial fat-suppressed T2-weighted image through liver shows multiple high signal intensity lesions throughout left lobe (arrows). B: Lesions demonstrate ring enhancement (arrows) on fat-suppressed, gadolinium-enhanced three-dimensional gradient echo images. Lesions resolved after antibiotic therapy. Right lobe was free of lesions, and right portal vein was absent, suggesting enteric source for abscesses. Note increased enhancement of right hepatic lobe (arrowhead). |
Bile duct hamartoma (Fig. 3.143; see Fig 3.8)—Small (usually< 1 cm), multiple, nonenhancing lesions. Often mistaken for simple cysts.
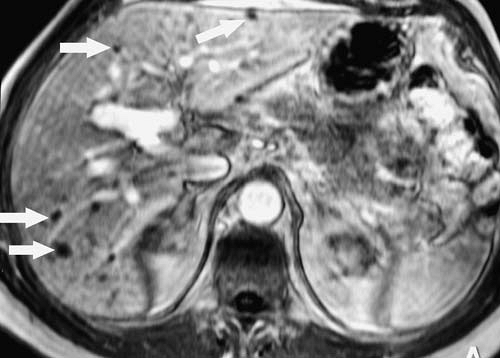 FIG. 3.143. Bile duct hamartomas. Gadolinium-enhanced T1-weighted gradient echo image shows multiple tiny, nonenhancing lesions throughout liver (arrows). This is same patient as in Figure 3.8. |
Biloma—Communication with biliary tree may be visible. May accumulate mangafodipir in the setting of an active bile leak.
Biliary cystadenoma or carcinoma (see Fig. 3.9)—Multilocular cyst with enhancing wall, septa, and mural nodules.
Choledochal cyst—Communicates with biliary tree. Central dot sign (portal triad vessels partially surrounded by dilated duct) often present with Caroli disease (see Fig. 3.13).
Cystic metastasis (ovarian, gastric, sarcoma, others) (Fig. 3.144)—Multiple, often with thick enhancing walls. Primary tumor or other evidence of metastatic disease may be visible.
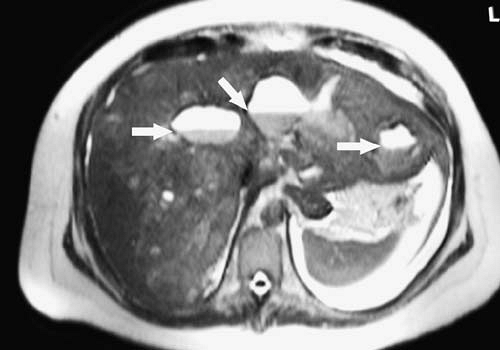 FIG. 3.144. Cystic metastases. Multiple cystic liver lesions demonstrating fluid-fluid levels (arrows) in patient with metastatic squamous cell carcinoma. |
Embryonal sarcoma (see Fig. 3.17)—Occurs predominantly in older children and adolescents, although young adults may develop embryonal sarcoma. Myxoid stroma makes these solid tumors appear cystic with areas of high signal intensity on T2-weighted images. Embryonal sarcoma typically exhibits heterogeneous enhancement of the periphery and septa on contrast-enhanced images.
Hematoma—Often heterogeneous with areas of increased signal intensity on T1-weighted images due to methemoglobin. History of trauma, recent biopsy, or other predisposing factor (e.g., liver tumor, thrombocytopenia, coagulopathy) is usually present.
Hydatid disease—Parasitic infection caused by Echinococcus granulosus. Endemic in sheep-raising regions, because domesticated livestock serve as intermediate hosts. Multiple, peripherally arranged daughter cysts are often visible on T2-weighted images.
Necrotic primary hepatic tumor—Irregular, thick enhancing rim usually present.
Simple cyst (see Fig. 3.15)—Nonenhancing fluid collection with no discernible wall.
References: 11
Liver Lesion with a Central “Scar”
Cavernous hemangioma (Fig 3.145)—Demonstrates nodular peripheral enhancement with nonenhancement of central scar.
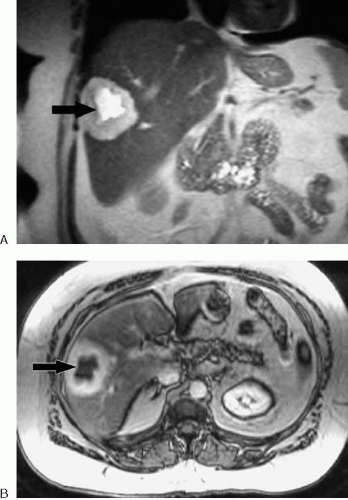 FIG. 3.145. Atypical hemangioma. Appearance of hemangioma in right hepatic lobe is atypical due to differing signal characteristics of center (arrow) and periphery of lesion on coronal HASTE image (A) and lack of central enhancement (arrow) on delayed gadolinium-enhanced T1-weighted image (B). |
Fibrolamellar hepatocellular carcinoma—Central scar, when present, is dark on T1- and T2-weighted images. Central scar typically does not enhance unless very delayed images are obtained.
Focal nodular hyperplasia (FNH) (Fig. 3.146)—FNH tends to be inconspicuous on all but arterial phase contrast-enhanced MR images (“stealth tumor”). Typically abuts the liver capsule and demonstrates marked enhancement on arterial phase images. Central scar is dark on T1-weighted images, is bright on T2-weighted images, and exhibits delayed (equilibrium phase) enhancement.
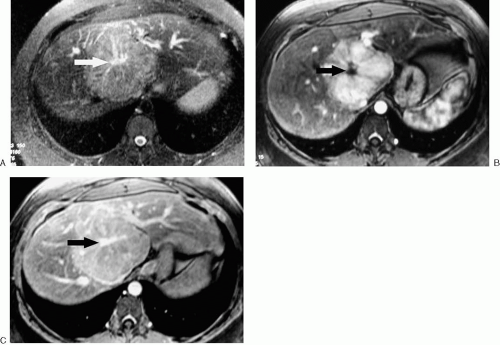 FIG. 3.146. Appearance of scar in focal nodular hyperplasia. Central scar is high signal intensity on T2-weighted image (arrow) (A), low signal intensity on early contrast-enhanced image (arrow) (B), and demonstrates delayed enhancement (arrow) (C). Note brisk arterial enhancement of mass (B). |
Hepatocellular adenoma—Central scars are uncommon but may occur as a consequence of intratumoral hemorrhage.
Peripheral cholangiocarcinoma (Fig 3.147)—Nonenhancement of central portions of tumor due to fibrosis or necrosis. Peripheral portions of tumor demonstrate gradual progressive enhancement.
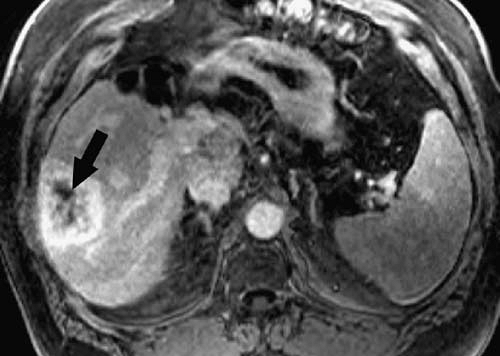 FIG. 3.147. Cholangiocarcinoma. Fat-suppressed T1-weighted image shows incomplete central enhancement of cholangiocarcinoma (arrow) of right hepatic lobe despite delay of 10 minutes after administration of gadolinium. |
Transient Hepatic Intensity Difference
Aberrant venous drainage—Anatomic variations in venous drainage (e.g., capsular veins, accessory cystic vein, or aberrant right gastric vein) may result in areas of transiently increased signal intensity on arterial phase images. Common locations for this phenomenon include the subcapsular liver and areas adjacent to the falciform ligament and gallbladder fossa.
Cirrhosis—Arterial-portal shunting is common in cirrhosis and may be confused for hepatocellular carcinoma on dynamic contrast-enhanced images.
Hemangioma—Mass associated with THID demonstrates typical imaging characteristics of hemangioma.
Hepatic vein thrombosis, obstruction, or occlusion—Abnormal signal intensity or abnormal/absent enhancement of hepatic veins is present. Intrahepatic venous collaterals may be visible in chronic cases.
Idiopathic—Occasionally, peripheral, wedge-shaped THID occurs without associated mass or discernible hepatic vascular abnormality.
Inflammation—THID may occur adjacent to an inflammatory process such as acute cholecystitis.
Portal vein thrombosis, obstruction, or occlusion (see Fig. 3.38)—Thrombosis is suggested by abnormal signal intensity or abnormal/absent enhancement of portal veins. A primary or metastatic liver tumor may also invade or obstruct portal vein branches.
Vena cava obstruction—Medial segment of left lobe often affected. Enlarged collateral thoracic veins often present with superior vena cava obstruction. Images through the thorax may demonstrate a mass, thrombus, or stenosis obstructing the superior vena cava.
Tumor—Tumors with increased arterial blood supply may cause increased enhancement of the surrounding hepatic parenchyma. Transient intensity difference is occasionally seen with hilar cholangiocarcinoma related to vascular compromise or biliary obstruction (Fig. 3.148). Any tumor that compresses or obstructs a portal vein branch may cause THID.
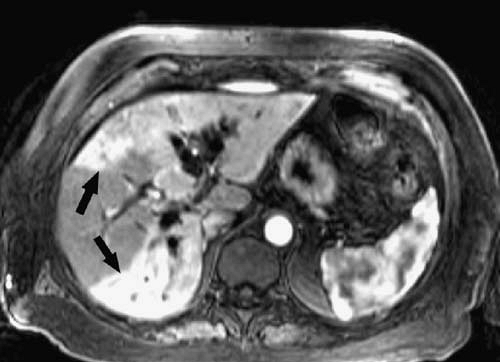 FIG. 3.148. Transient hepatic intensity difference associated with cholangiocarcinoma. Arterial phase fat-suppressed image demonstrates relative hyperperfusion of left hepatic lobe and right posterior segment (arrows) in patient with obstructing cholangiocarcinoma. Portal vein was patent on other images (not shown). |
References: 12
Posttreatment Appearance of the Liver and Malignant Liver Tumors
Ablative Therapies
A variety of local ablative therapies are performed for focal malignant hepatic tumors, including cryotherapy, laser thermal ablation, microwave coagulation therapy, percutaneous ethanol ablation, and radiofrequency ablation. MRI is useful to follow response to treatment. Most of these techniques induce a thermal injury (freeze or burn) in the tumor and surrounding liver. The exception is ethanol ablation, which creates tumor death through cellular dehydration and vascular thrombosis. Regardless of mechanism, these techniques all produce a focal area of tissue necrosis. This necrotic area appears avascular on contrast-enhanced MR images, although a thin enhancing rim of granulation tissue may persist for several months after treatment. The appearance of the ablated tissue is variable on precontrast T1- and T2-weighted images. Most lesions demonstrate diminished signal intensity on T2-weighted images, presumably resulting from tissue dehydration and devascularization, although focal areas of markedly increased intensity may be seen corresponding
to hemorrhage or liquefaction. Increased signal intensity is common on T1-weighted images due to hemorrhage or proteinaceous material (Fig. 3.149). Successfully treated lesions should progressively decrease in size following ablation. Areas of moderately increased signal intensity on T2-weighted images, areas of nodular or intratumoral enhancement with gadolinium, or lesion enlargement should be viewed as possible tumor recurrence or evidence of residual disease (Fig. 3.150).
to hemorrhage or liquefaction. Increased signal intensity is common on T1-weighted images due to hemorrhage or proteinaceous material (Fig. 3.149). Successfully treated lesions should progressively decrease in size following ablation. Areas of moderately increased signal intensity on T2-weighted images, areas of nodular or intratumoral enhancement with gadolinium, or lesion enlargement should be viewed as possible tumor recurrence or evidence of residual disease (Fig. 3.150).
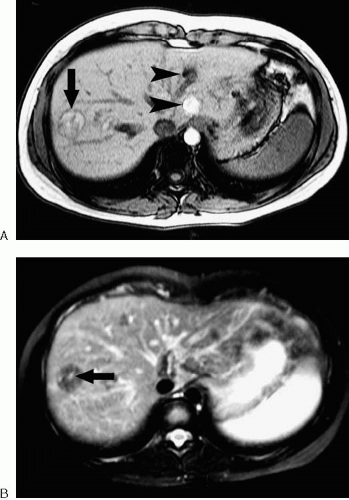 FIG. 3.149. Radiofrequency ablation lesion. A: T1-weighted spoiled gradient echo image demonstrates sharply defined lesion (arrow) of slightly heterogeneous high signal intensity near dome of liver. Lesion has thin low signal intensity capsule. Note phase ghosts (arrowheads) from aorta. B: Fat suppressed T2-weighted image of same lesion as (A) shows predominantly low signal intensity with the exception of tiny high signal intensity foci (arrow). Appearance of this lesion was stable over a period of 6 months.
Related posts:Stay updated, free articles. Join our Telegram channel
Full access? Get Clinical Tree
 Get Clinical Tree app for offline access

|


