The clinician evaluating a patient with renal transplant dysfunction has the choice of a variety of imaging procedures, including ultrasound (US), nuclear medicine (NM), computed tomography (CT), magnetic resonance imaging (MRI), and less commonly used today, excretory urography. Imaging evaluation is usually initiated either with duplex US, which provides anatomic imaging and some physiologic information quickly, noninvasively, and portably, or with NM studies, which provide physiologic information and less morphologic information. CT provides superb cross-sectional information but involves ionizing radiation and the use of iodinated contrast medium and lacks portability. MRI provides superb anatomic information, can noninvasively image large vessels, and can evaluate function without risk for acute renal failure. MRI, however, is not portable, is expensive, and requires special equipment for guided interventions. In addition, there is an association between MRI contrast agent use (gadolinium) and the development of nephrogenic systemic fibrosis (NSF). In this chapter, we discuss the use of each of these imaging techniques in clinical renal transplantation.
RADIOLOGIC EVALUATION OF THE LIVING DONOR
The process of evaluating a potential living donor is discussed in Chapter 7. The radiologic studies used to screen potential living donors are performed to ensure that after nephrectomy, the donor is left with an anatomically and functionally normal kidney. The number and branching pattern of the renal arteries and veins are identified. This information permits the surgeon to decide which kidney is to be removed and to determine the suitability for laparoscopic compared with open nephrectomy (see Chapter 6). The traditional donor radiologic workup typically consisted of an intravenous urogram followed by angiography. With current technologic advances in CT and MRI scanning, angiographic-type images of the kidney vasculature can be obtained without the need for catheter angiography.
Computed Tomographic Angiography, and Urography
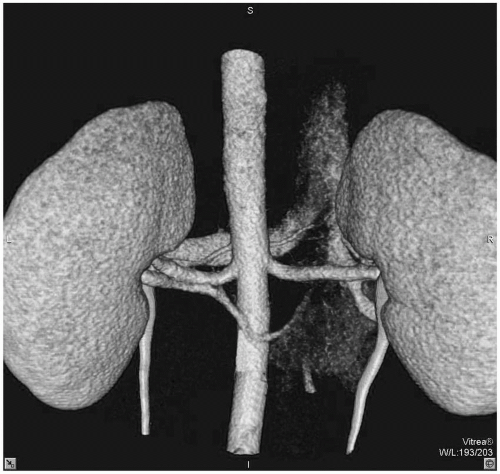
The helical CT scan followed in the same session by a postcontrast radiograph produces a modified intravenous urogram, usually called a computed tomographic urogram (CTU). Helical CT allows very rapid acquisition of a volume of data, and the advent of multidetector helical CT has further improved this technique. Computed tomographic angiography (CTA) differs from CTU in that intravenous contrast is injected rapidly (4 to 5 mL per second), imaging sequence begins at peak contrast concentration in the aorta (20 seconds after injection). The use of very thin beam collimation (0.5 to 3 mm) yields highresolution images of vessels. The resulting volume of data can be computer rendered and displayed in a variety of ways, and made to look like a projectional radiographic angiogram. This technique can reliably delineate relevant vascular anatomy for surgical planning (Plate 13.1). This method has essentially replaced catheter angiography in most centers.
PLATE 13.1 Computed tomographic angiogram of renal arteries with volume-rendered reformation. Posterior vantage with aorta on left, demonstrating two left renal arteries. see color image
The urographic images of the CTU permit an evaluation of the intrarenal collecting system, ureters, and bladder. This allows detection of anatomic variants and pathology, such as supernumerary ureters, ureteropelvic junction obstruction, papillary necrosis, calyceal diverticula, extrarenal pelves, ureteroceles, and urolithiasis.
Magnetic Resonance Angiography and Urography
MRI and MR angiography and venography can provide similar information to CT and CTA. Drawbacks include less optimal evaluation of collecting systems and insensitivity for stone detection.
RADIOLOGIC TECHNIQUES IN THE EARLY POST-TRANSPLANTATION PERIOD
The indications for radiologic investigations in the early post-transplantation period are discussed in Chapter 9.
Allograft Size
Renal transplant size increases in most acute processes and is thus a nonspecific indicator of renal dysfunction. Some studies show that an increase in graft cross-sectional area of more than 10% (measured by US) is suggestive of acute rejection, but the finding is too nonspecific to be clinically reliable. Practical use of allograft size is also limited by the fact that a normally functioning graft may be increased in size by up to 30% 2 months after transplantation. The volume of a normal renal transplant usually stabilizes by 6 months.
Collecting System Dilation
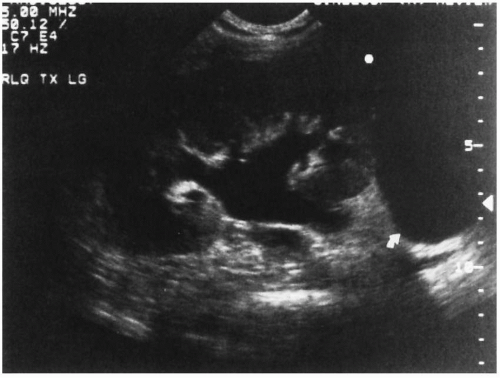
Collecting system dilation may be obstructive or nonobstructive. The degree of dilation is often expressed using a grading system (grades I to IV) for US or excretory urography, or as mild, moderate, or severe; however, both of these systems are subjective. Obstruction of the transplant collecting system may occur secondary to extrinsic processes (e.g., peritransplantation fluid collection), ureteral stricture (as a consequence of vascular insufficiency or rejection), or intraluminal lesions, such as kidney stone, blood clot, or sloughed papilla (Fig. 13.1). A mild, self-limited obstruction may result from early postoperative edema at the ureteroneocystostomy site, and minimal dilation may persist despite resolution of obstruction. Other causes of nonobstructive collecting system dilation include a full bladder, rejection, infection, and resolved, prior obstruction. This latter cause of nonobstructive dilation is particularly relevant in the transplanted kidney because the collecting system is denervated and has no tone.
The absence of collecting system dilation does not entirely exclude the possibility of obstruction. The most reliable noninvasive method to diagnose obstruction is progressive collecting system dilation on serial sonograms. Antegrade pyelography, a mini-nephrostomy, or a Whitaker pressure-flow study may be necessary to determine whether collecting system dilation has an obstructive or nonobstructive cause.
NM imaging of ureteral obstruction typically shows normal perfusion and parenchymal uptake of tracer by the transplant, but pooling of tracer in the renal pelvis and prolonged pelvic retention. An obstructed system does not respond to the administration of diuretics such as intravenous furosemide. A system with an emptying half-time of more than 20 minutes is considered obstructed (normal emptying half-time is less than 15 minutes). Table 13.1 gives an overview of radiopharmaceuticals currently in use. The use of the resistive index (RI; see “Acute Rejection,” below) to distinguish obstructive from nonobstructive pyelocaliectasis has been proposed, but data regarding its clinical utility are inconclusive.
FIGURE 13.1 Sonogram demonstrating hydronephrosis secondary to peritransplantation fluid collection.
TABLE 13.1 Radiopharmaceuticals for Use in the Quantification and Evaluation of Renal Transplant Function or Morphology
Radionuclide
Biologic Compound
Percentage
Physiologic or Biochemical Mechanism
Imaging
Application
Comment
99mTc
DTPA
Diethylenetriamine pentaacetic acid
>90
Glomerular filtration, no resorption
Yes
Flow and function
Plasma binding higher than MAG3
99mTc
MAG3
Mercaptoacetyltriglycine
>95
Tubular secretion
Yes
Flow & Function
Most commonly used
99mTc
DMSA
Dimercaptosuccinic acid
7-14
Excreted into urine, binds to SH groups in cortical tubule cells
Yes
Parenchyma
Pyelonephritis, infarct, scar
67Ga
Ga
Gallium citrate
Localizes in sites of inflammation, and certain neoplasms
Yes
Inflammation
Nonspecific
111In or 99mTc
WBC
White blood cells
Localizes in inflammatory tissue
Yes
Infection
111In
Lymphocytes
Localizes in inflammatory tissue
Yes
Rejection
Difficult to extract and label
ERPF, effective renal plasma flow; Ga, gallium; GFR, glomerular filtration rate; I, iodine; In, Indium; Tc, technetium; WBC, white blood cell count.
Peritransplantation Fluid Collections
Peritransplantation fluid collections may be produced by lymphoceles, urinomas, hematomas, and abscesses; all of these may compress the ureter and iliac veins, resulting in hydronephrosis and lower extremity edema. They all manifest as fluid collections on cross-sectional imaging studies (US, MRI, CT) or as photopenic regions on NM scans or scintigrams. Although there are imaging features suggestive of the nature of the fluid collection, their appearance is usually not sufficiently specific; imaging-guided aspiration is often necessary.
Hematomas
Hematomas are common in the immediate postoperative period; they may be extrarenal or subcapsular in location and usually resolve spontaneously. They may also occur after a biopsy or result from rupture of a graft pseudoaneurysm. On occasion, the hematoma may be large enough to obstruct the ureter. The US appearance of a hematoma varies with time, being echogenic in the acute phase and decreasing in echogenicity as clot lysis occurs. An acute hematoma is of high attenuation on CT and also decreases with time. The signal intensity of a hematoma on MRI is variable.
Urinomas
Urinomas resulting from extravasation of urine from the renal pelvis, ureter, or ureteroneocystostomy usually occur in the first 1 to 3 weeks after transplantation and may be caused by disruption of the ureterovesical anastomosis, incomplete bladder closure, ischemia of the collecting system, postbiopsy injury, or severe obstruction.
US reveals a nonspecific, usually nonseptated, fluid collection, often adjacent to the lower pole of the transplant. The CT appearance of a urinoma is a peritransplantation fluid collection that may contain contrast-opacified fluid that is isodense to collecting system fluid if the leak is active at the time of the scan. MRI reveals a fluid collection that has identical signal characteristics to urine in the bladder. The leak may be extraperitoneal, intraperitoneal, or both, and in the latter circumstances, ascites may also be present. Characterization of the fluid can be achieved by obtaining a sample using US-guided aspiration and then determining the creatinine concentration (see Chapter 9).
Cystography is the examination of choice to confirm or exclude the bladder as the source of leak. If the bladder is not the source, the extravasation must be from above the ureterovesical anastomosis. If kidney function is adequate, a nuclear medicine study or a urogram may visualize the urinoma, although the precise location of the leak may be difficult to identify. NM imaging typically shows abnormal accumulations of activity outside the collection system (Fig. 13.2). Occasionally, this finding may be confused with ureteral stasis, in which case the abnormal accumulation will resolve when the patient voids or is given intravenous furosemide.
Lymphoceles
Lymphoceles are the most common type of peritransplantation fluid collection and are the product of extraperitoneal or renal lymphatic disruption at surgery or during graft harvesting (see Chapter 8). They usually occur several weeks to months after surgery. The incidence of lymphoceles has been reported to be higher when rapamycin is used for early post-transplantation immunosuppression. Small lymphoceles are common and are usually asymptomatic, but larger ones can cause obstruction.
The typical US appearance of a lymphocele is a fluid collection inferior and medial to the transplant that often contains septations and low-level echoes (Fig. 13.3). The MRI signal characteristics of a lymphocele tend to be of low signal intensity on T1-weighted images and of high signal intensity on T2-weighted images.
Only gold members can continue reading. Log In or Register to continue