Approximately 10% to 15% of the chronic gastroesophageal reflux disease population is at risk for the development of Barrett’s esophagus, particularly in the setting of other risk factors, including male gender, Caucasian race, age more than 50, and central obesity. The risk of cancer progression for patients with nondysplastic BE has been estimated to be approximately 0.2% to 0.5% per year. Given these low progression rates and the high cost of endoscopic surveillance, cost-effectiveness analyses in this area are useful to determine appropriate resource allocation.
Key points
- •
Cost-effectiveness analyses compare costs associated with administration of therapy for a condition and effectiveness, usually measured in life-years saved or quality-adjusted life years.
- •
Economic modeling studies in the areas of Barrett’s esophagus (BE) have been useful to determine whether current practices of screening and surveillance are cost-effective.
- •
Key variables in these models include cost of therapy, progression rates from nondysplastic BE to dysplasia and cancer, and efficacy of therapy in eradication of dysplasia and prevention of cancer.
- •
Modeling studies have demonstrated that screening and surveillance are considered to be cost-effective, particularly for high-risk groups of patients with BE.
- •
Endoscopic therapy with ablative therapies is considered to be cost-effective for patients with BE and dysplasia.
Introduction
Any medical therapy rendered is associated with costs, which can include direct costs to patients, hospitals, and/or third-party payers, and indirect costs such as impact on health-related quality of life (HRQL), work productivity, and other measures. Underlying health states and therapies may also be associated with impact on quality of life due to associated symptoms, can impact duration of life expectancy, and in other cases, may affect work productivity and/or quality.
Cost-effectiveness analysis was a concept introduced in the 1990s as a means to evaluate costs and effectiveness of different medical therapies. Costs are typically estimated based on third-party payers or Medicare rates for medications and procedures performed. Effectiveness measures can include impact on life expectancy, calculated from the US Life Tables based on patient age, or quality-adjusted life years (QALYs) adjusted by number of life years remaining. All costs and health state utility values are discounted, typically by 3% per year. Scores from generalized or disease-specific instruments cannot be used in the calculation; rather cost-effectiveness analyses require utility values, numbers representing health-quality of life states between 0 and 100. To obtain utilities, either the time-tradeoff or the standard gamble (SG) exercises can be used. Although traditionally paper probability wheels were used, most studies now use computer programs to interview patients. First, the life expectancy of the patient is calculated based on current US Life Tables. In the time-tradeoff exercise, patients are asked how much of their remaining life they would like to trade to rid themselves of their current disorder or health state. The amount traded can range from months to years and is calculated by the formula:
which generates a number between 0 and 1, where 0 represents the state of death, and a score of 1, a state of perfect health.
In the SG exercise, patients are invited to engage in a gamble exercise wherein they are told there is a cure for their underlying disorder, but the treatment is associated with a small risk of death. The patient is asked to determine the risk of death that would be acceptable to achieve a cure. In both of these exercises, a “ping-pong” strategy is used whereby patients are initially presented with large values of risk or life years to trade alternating with very small values, and this value is adjusted until the patient decides on a final value.
In the setting of Barrett’s esophagus (BE) cost-effectiveness analysis, health-state utility values that might be of interest include those included with the symptoms of gastroesophageal reflux disease (GERD) in patients with BE, risks of cancer associated with states of dysplasia, symptoms associated with cancer, and symptoms that might develop after esophagectomy. Values that have been derived from the literature and have been used in the cost-effectiveness studies to be discussed are shown in Table 1 . Based on the presence of GERD symptoms, patients with BE did not show lower quality of life scores compared with patients with GERD in one study. When patients with BE were asked theoretically to imagine they had BE in association with a dysplastic state and were educated about associated risks of cancer, lower HRQL values were obtained. Of note is that values obtained using SG techniques are typically higher compared with time tradeoff techniques (TTO) because patients are less willing to undergo therapies with a certain percentage risk of death compared to a trade where they are able to give away a certain amount of time in order to eliminate a certain condition or health state.
| Author, Year | Utility Exercise | Patients | Findings |
|---|---|---|---|
| Gerson et al, 2005 | TTO and SG | 220 GERD 40 (25%) BE | TTO 0.94 on medications and 0.90 off PPI SG 0.94 for both TTO for BE 0.92 on medications and 0.90 off PPI |
| Hur et al, 2006 | SG | 20 patients BE | NDBE = 0.95; Postesophagectomy for HGD with dysphagia = 0.92; Post-PDT for HGD with recurrence uncertainty = 0.93; Post-PDT for HGD with recurrence uncertainty and dysphagia = 0.91; Intensive endoscopic surveillance for HGD = 0.9 |
| Gerson et al, 2007 | TTO | 60 patient BE 40 patients GERD | NDBE = 0.91 LGD = 0.85 HGD = 0.77 Esophageal cancer = 0.67 |
Creation of a Decision Model
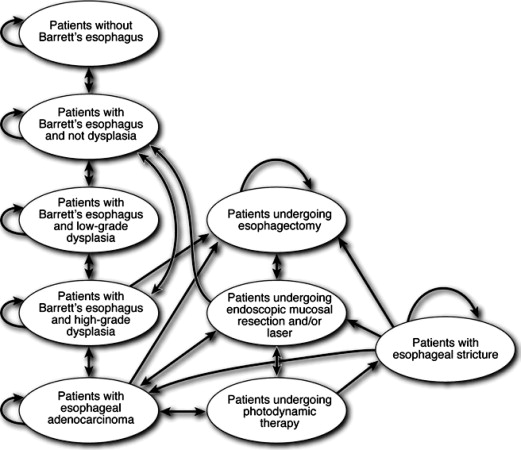
The first decision in the creation of a cost-effectiveness model is the duration of the model, based on the available literature. In situations where there are only short-term data available, such as, for example, duration of an endoscopic therapy for GERD, a model can be created in a fixed time period to reflect the available data regarding treatment duration. If patients progress in the model from one state to another without the possibility of transitioning back to the original state, then a standard decision tree can be created. If, however, the patient can transition between different states of the model until death occurs, a Markov process should be used ( Fig. 1 ). These models can be created using standard programs including Excel, or commercially available programs for modeling (for example, TreeAge Software, Boston, MA, USA). To create the model, the investigator needs to be able to input the duration of each cycle (which could range from a month to several years), the probability of being in each health state, probabilities for transitioning to different health states, costs associated with each treatment rendered, and utility values for each health state. The end result is a calculation of total costs and utility values for each treatment arm of the model.
A base case for each model is required and usually involves a typical patient with a condition (in the case of BE, a 50-year-old Caucasian man with chronic GERD) with the baseline being absence of treatment or screening. In this arm, the probabilities for the development of dysplasia and/or cancer are calculated based on natural history information. If the comparator treatment is both less expensive and more effective compared with the baseline arm, it is stated to “dominate” the other strategies, and a cost-effectiveness ratio is not calculated. If, on the other hand, the comparator treatment is more expensive but also more effective, then an incremental cost-effectiveness ratio (ICER) is calculated using the following formula:
and is expressed as dollars per QALY in a cost-utility analysis, or life-years saved if life expectancy is used for a cost-effectiveness analysis. A treatment is deemed to be acceptable from a societal point of view if the ICER is roughly less than $50,000 per QALY.
Methods for This Analysis
To perform the analysis of the literature for this article, a search was performed using PubMed/Medline from 2000 to 2014 using the following search terms, including “Cost-Benefit Analysis,” “Barrett’s esophagus,” “Markov chains,” “esophageal cancer,” “chemoprevention,” “aspirin,” “proton pump inhibitor therapy,” and “quality-adjusted life years.” Only articles performing an analysis using US dollars and either QALY or life-years gained were included in this analysis.
Studies Assessing Cost-Effectiveness of Screening and Surveillance for Barrett’s Esophagus
As shown in Table 2 , there have been 7 cost-effectiveness studies assessing whether screening and surveillance of BE are cost-effective. The method of screening included standard sedated upper endoscopy (EGD) in 3 studies, unsedated transnasal endoscopy (uTNE) in one study, esophageal capsule endoscopy (ECE) in 2 studies, and use of a Cytosponge in a recent analysis.
| Author, Year | Patient Population/Screening Modality | Model Design | Results | Key Model Parameters |
|---|---|---|---|---|
| Sonnenberg et al, 2002 | 100,000 subjects 60-y-old with BE | Markov model Surveillance with EGD every 2 y Esophagectomy for HGD | ICER $17K/life-saved for screening | BE to cancer 0.5% 20% survive postesophagectomy Life-years saved |
| Inadomi et al, 2003 | 50-y-old Caucasian men with chronic GERD undergoing sedated EGD | Markov model Surveillance only if dysplasia present Esophagectomy for HGD or cancer | ICER $10K/QALY for screen + surveillance dysplasia ICER $596K/QALY surveillance all BE every 5 y compared with surveillance for dysplasia | BE prevalence 10% Prevalent cancer in BE 6.7% BE to cancer 0.5% Quality-adjusted life-years with TTO based on expert opinion Esophagectomy only for cancer |
| Gerson et al, 2004 | 50-y-old Caucasian men with chronic GERD undergoing sedated EGD | Markov model Surveillance according to guidelines Esophagectomy for HGD Endoscopic therapy for nonsurgical candidates | ICER for screening of $12K/life-year gained | BE prevalence 10% BE to cancer 0.5% Prevalent cancer 0.8% Outcome: life-years saved |
| Nietert et al, 2003 | 50-y-old man with chronic GERD | Markov model | Compared with no screening uTE: $56K/QALY EGD: $87K/QALY Screening with uTE compared with EGD: $709K/QALY | Outcome: QALY BE prevalence 3% BE to EAC 0.5% per year Sensitivity and specificity of uTNE: 95% |
| Rubenstein et al, 2007 | 50-y-old Caucasian men with chronic GERD | Markov model Screening with EGD or ECE followed by EGD compared with no screening | EGD compared with no screening ICER $11K/QALY ECE less effective and more expensive compared with EGD | Outcome: QALY BE prevalence: 10% BE to EAC: 0.5% ECE sensitivity: 85% EGD sensitivity: 100% |
| Gerson & Lin, 2007 | 50 y-old men with chronic GERD | Markov model Screening with EGD or ECE followed by EGD compared with no screening | Compared with no screening, ICER for EGD $5K/LY ECE arm more expensive and less effective | Outcome: life-years saved BE prevalence: 10% BE to EAC: 0.5% Sensitivity of ECE: 70% Sensitivity of EGD: 85% |
| Benaglia et al, 2013 | 50 y-old man with chronic GERD | Microsimulation model Cytosponge or EGD compared with no screening Endotherapy (RFA + EMR) and esophagectomy modeled to treat HGD or EAC | Cytosponge screening compared with no screening with ICER $16K/QALY EGD more expensive and less effective | Outcome: QALY BE prevalence: 8% BE to EAC: 0.15% Cytosponge participation: 45% EGD participation: 23% EGD sensitivity and specificity: 100% Cytosponge sensitivity 73% and specificity 94% |
In the first study by Sonnenberg and colleagues, the authors compared surveillance of nondysplastic BE (NDBE) with upper endoscopy every 2 years to no screening and found that this practice was cost-effective with an ICER of $17K per life-year saved. Patients with high-grade dysplasia (HGD) were modeled to undergo esophagectomy. Costs included $644 for EGD, $21K for esophagectomy, and $44K for cancer care. Surveillance became less cost-effective if the decrement in HRQL increased after esophagectomy or when the efficacy of screening in reducing the incidence of adenocarcinoma decreased. With sensitivity analyses, the ICER of surveillance ranged from $5000 to $85,000 per life-year saved.
Inadomi and colleagues published a model focusing on surveillance in high-risk BE groups in the Annals of Internal Medicine in 2003. In this study, the authors used a Markov model for a base-case patient who was a 50-year-old Caucasian man with chronic GERD. The authors compared 2 strategies to no surveillance: the first involved identification of BE followed by surveillance only if dysplasia was detected; in the second arm, identification of BE was followed by surveillance for nondysplastic as well as dysplastic BE. The authors modeled that the presence of HGD would increase surveillance to every 3 months, and that esophagectomy would be performed in the presence of cancer. QALYs were used with health-state utility values estimated from TTO values obtained from experts. QALY values after esophagectomy were available from patients. Based on data from the Health Care Financing Administration, costs for EGD were estimated at $830, esophagectomy at $19,000, and care of cancer $34,000. The authors found that compared with no surveillance, screening with surveillance of dysplastic BE only was cost-effective with an ICER of $10,440 per QALY, but that surveillance of NDBE was not cost-effective compared with surveillance only of dysplastic cases. It should be noted, however, that surveillance of NDBE would be considered to be cost-effective, if compared with the strategy of no screening or surveillance. However, because the primary aim of the model was to examine the cost-effectiveness of surveillance of dysplasia compared with no screening or surveillance, the arm examining surveillance of NDBE was not cost-effective because of the very small to no change in QALY values between arms. The model was most sensitive to progression rates for HGD to cancer and the prevalence of BE.
A subsequent model by Gerson and colleagues in 2004 examined the cost-effectiveness of screening and surveillance for patients with BE. Surveillance intervals occurred according to the current society guidelines, including every 3 years for NDBE, every 1 year for LGD, and every 3 months for HGD. Patients found to have cancer who were not surgical candidates could undergo endoscopic mucosal resection for nodular disease, or photodynamic therapy (PDT) for flat disease. Costs included $810 for EGD, $15,500 for esophagectomy, $6100 for PDT, $10,700 for chemotherapy, and $5700 for radiation therapy. The ICER for screening and surveillance was $12K/life-year gained but exceeded $100K if the prevalence of BE decreased to 1%. Overall, these 3 models demonstrated that surveillance of BE is cost-effective depending on the prevalence of BE and the progression rates to cancer. If, however, most cancers are found on the initial screening examination, then subsequent surveillance may not be cost-effective. The addition of endoscopic therapy prolongs survival and renders surveillance more cost-effective.
Unsedated transnasal endoscopy (uTNE) has demonstrated excellent sensitivity and specificity as a screening tool for BE with lower associated patient costs and indirect costs, such as time lost from work. A 2003 cost-utility analysis compared screening with uTNE to sedated EGD and no screening. The costs for uTNE and EGD based on Medicare reimbursement rates were $97 and $506, respectively. The authors assumed a 95% sensitivity and specificity for uTNE in the detection of BE. Compared with no screening and assuming a BE prevalence of 3%, the ICER of uTNE was $56K/QALY. The ICER estimates were very sensitive to the prevalence of esophageal adenocarcinoma (EAC). If 1% of BE patients developed EAC per year, the ICERs for uTNE and EGD decreased to $15K/QALY and $25/QALY, respectively. The no screening strategy dominated when the EAC incidence decreased to 0.25%/y. In addition, if the cost of uTNE exceeded $330, then the EGD strategy became the most cost-effective. The QALY value used for most of these models for patients after esophagectomy was 0.97, based on a prior work by Provenzale and colleagues published in abstract form interviewing patients with TTO. The authors noted that if this value decreased to 0.90, then both screening arms would no longer be cost-effective with ICERs exceeding $150K/QALY, and at a value of 0.86, the no screening arm would dominate.
Esophageal capsule endoscopy (ECE) was introduced in 2004 as a noninvasive means of imaging the esophagogastric junction (EGJ). By capturing 14 frames per second compared with 2 frames per second with conventional small bowel capsule endoscopy, the hope was to successfully image the EGJ with the patient in the supine position after ingestion to slow down esophageal transit. A meta-analysis published in 2009 based on 9 studies and 618 patients demonstrated sensitivity and specificity of 78% and 90% for ECE in the diagnosis of BE using EGD as the gold standard.
Two cost-effectiveness studies were published to determine whether usage of ECE would be cost-effective as a screening modality. In the first study by Rubenstein and colleagues, the authors included costs for EGD with biopsy of $830 and ECE of $740 based on 2005 Medicare reimbursement rates. Compared with EGD, which was assumed to have an accuracy of 100% for the diagnosis of BE, the sensitivity of ECE was modeled to be 85%. Compared with the no screening strategy where patients lived an average of 23 additional years after the enrollment age of 50 and accrued an average of 16.47 QALYs with average costs of $102, the patients in the EGD arm accrued costs of $2304 with an average of 16.66 QALYs resulting in an ICER of $11K per QALY gained compared with no screening. The esophageal capsule arm had costs of $2348, was associated with 16.64 QALYs, and was therefore dominated (more costly and less effective) by the standard EGD arm.
In the second study comparing ECE to standard EGD by Gerson and Lin, a similar Markov model was constructed comparing no screening with ECE followed by EGD if BE was suspected, or standard EGD. Using weighted probabilities of sensitivities for ECE from recent clinical trials, the sensitivity of ECE was 70% and the sensitivity of EGD was 85% based on clinical trial data. It was assumed that there would be poor visualization of the EGJ in 50% of the cases, which would lead to an EGD examination. Costs used included $785 for ECE and $179 for EGD with biopsy. Assuming a theoretic cohort of 10,000 patients with GERD, the initial EGD cost was $1988 and was associated with 18.54 life-years compared with $2392 and 18.36 life-years for the ECE arm and $901 and 18.30 life-years for the no screening arm. The ICER of screening with EGD compared with the no screening arm was $4530 per life-year gained and again dominated the ECE arm, which was more expensive and less effective. Since the publication of these 2 cost-effectiveness analyses, there have not been further advances in esophageal capsule technology to warrant updates in cost-effectiveness analyses for this technology.
A recent cost analysis examined the potential of a Cytosponge for BE screening. As described by the authors, the Cytosponge is an ingestible gelatin capsule containing a compressed mesh attached to a string; once swallowed, the capsule is dissolved and the sponge is released at the level of the EGJ. The cytology specimen is then collected and analysis is performed with immunostaining for trefoil factor 3, a diagnostic marker of BE. For patients with BE segments 1 cm or larger, the Cytosponge has a sensitivity of 73% and specificity of 94% for BE. Patients found to have NDBE underwent surveillance every 3 months and LGD every 6 months. HGD or esophageal cancer was treated with either endotherapy (radiofrequency ablation [RFA] with or without endoscopic mucosal resection [EMR]) or esophagectomy. Costs in the model included $152 for the Cytosponge and $786 for endoscopy with biopsy. The ICER for usage of the Cytosponge was $16K/QALY; Cytosponge screening followed by treatment of patients with dysplasia or intramucosal cancer (IMC) cost an additional $240 with a mean gain of 0.015 QALYs. Compared with no screening, the EGD arm cost $299 and was associated with 0.013 QALYs with an ICER of $22K/QALY. Therefore, the Cytosponge arm was less costly and more effective compared with standard EGD.
Chemoprevention in Barrett’s Esophagus
There were 3 published studies examining the potential role of chemopreventive agents including aspirin (ASA), statins plus aspirin, and proton pump inhibitor (PPI) therapy.
In the first study published in 2004, Hur and colleagues constructed a Markov model to compare ASA usage, endoscopic surveillance with biopsies, both therapies, or neither therapy. The authors modeled risk of stroke and gastrointestinal (GI) bleeding associated with daily ASA therapy. The costs were $1 for daily ASA usage per month and $830 for EGD with biopsy. Base-case results ( Table 3 ) demonstrated that ASA was less expensive and more effective compared with no therapy. ASA plus endoscopic therapy was also cost-effective. The benefits of ASA continued down to an effectiveness for cancer prevention of 10%.
| Author, Year | Chemopreventive Agent | Model Design | Results | Key Model Parameters |
|---|---|---|---|---|
| Hur et al, 2004 | 325 mg ASA daily | Markov model 55-y-old man with BE. Compared no therapy to daily ASA, endoscopic surveillance alone or both ASA + endoscopy |
|
|
| Choi et al, 2014 | Statins/ASA | Markov model 50-y-old with BE Surveillance with EGD or surveillance with EGD plus ASA 325 mg daily or EGD plus statin daily or EGD plus ASA + statin | ASA strategy dominated EGD alone ($6900 less and 0.167 QALYs). ICER of $38K/QALY for statin + EGD and $16K/QALY for statin + ASA + EGD | Outcome: QALY ASA 53% reduction in EAC Statins 54% reduction in EAC ASA + statin 78% reduction in EAC Complications for ASA and statins included |
| Sharaiha et al, 2014 | PPI | Markov model 50-y-old white men with BE PPI + EGD Endotherapy and esophagectomy for HGD and/or cancer | ICER for PPI $12K/QALY compared with no PPI | Outcome: QALY BE to EAC 0.5% PPI therapy 50% reduction in EAC risk |
Related posts:


Stay updated, free articles. Join our Telegram channel

Full access? Get Clinical Tree


