Fig. 1
Anatomic structures in dissected animals. (a) Exposed aorta in 26-week-old wild type mouse on high-fat diet. Note that the aorta appears transparent following an Intraventricular flush with saline. Heart and kidneys still in situ to allow for anatomic orientation. (b) Exposed aorta in 26-week-old LDL receptor-deficient mice (LDLR−/−) on high-fat diet for 20 weeks. Note visible white atherosclerotic plaques in all mayor vessels including abdominal aorta and carotid arteries
4.
Flush aorta with saline to reduce noise.
5.
Before removing the aorta from the body, make sure that the connective tissue and smaller vascular branches are fully removed from the aorta. Then detach aorta starting with the femoral-, then renal-, subclavian-, and finally the carotid arteries.
6.
Put vessel in a small petri dish. Flush again with saline or similar solutions.
3.4 Imaging
1.
After dissection, put vessels on polypropylene-foil in the desired orientation. Consider imaging vessels from treatment- and control-group side by side to account for serial differences in exposure conditions over time (see Note 5 ).
2.
Move prepared specimens immediately to laser scanner (Odyssey Imaging System, LI-COR Biotechnology, Lincoln, NE). As the laser scanner emits and detects light from below, put prepared foil upside down on the scanner, allowing for direct contact of the aorta to the scanner.
3.
Use a saline-filled syringe with a small needle to fill the capillary gap between foil and scanner with fluid. This way, specimens are pushed down in position, while being kept moist during the process of the scan. Make sure to remove any air-bubbles before starting the scan.
4.
Adjust position and size of the scanned area according to your samples. Set exposure and resolution according to your needs for detail and signal. Note that higher resolution results in longer scans. Make sure that signal intensities do not exceed the chosen sensitivity. Try to use the same set of settings throughout all of your experiment to make serially acquired samples comparable.
5.
Following your scan, samples should be immediately fixed or frozen in a cryogenic compound to allow for histologic processing later on.
3.5 Analysis and Post-processing
1.
Define regions of interest within the scanned pictures and measure signal intensity of each channel using the scanner software.
2.
Get Clinical Tree app for offline access

Greyscale pictures generated by the scanner software can be further processed in Image J. Here, adjust the display range before applying lookup tables to visualize signal intensities in color (The lookup table used in Fig. 2 is ‘Thal’).
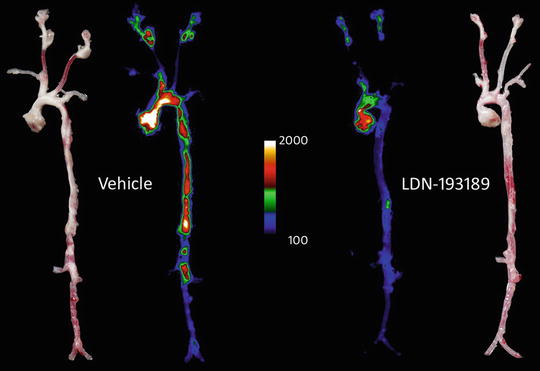
Fig. 2
 Propagation and Culture of Human Renal Fibroblasts
 Isolation and Primary Culture of Murine Podocytes with Proven Origin
 Isolation and Propagation of Rat Peritoneal Mesothelial Cells
 An In Vitro Murine Model of Vascular Smooth Muscle Cell Mineralization
 The Isolation and Quantitation of Fetuin-A-Containing Calciprotein Particles from Biological Fluids
 Intravital Multiphoton Imaging of the Kidney: Tubular Structure and Metabolism


Heat map of two aortas taken from 26-week-old LDLR−/− mice on high-fat diet for 20 weeks and treated with either 2.5 mg/kg LDN-193189 or Vehicle. Heat maps are accompanied by the respective daylight photomicrographs of the isolated vessels (far left and right). Signals imply signal intensity of Osteosense™ 680, measuring osteogenic activity in each vessel
Related posts:
Propagation and Culture of Human Renal Fibroblasts
Isolation and Primary Culture of Murine Podocytes with Proven Origin
Isolation and Propagation of Rat Peritoneal Mesothelial Cells
An In Vitro Murine Model of Vascular Smooth Muscle Cell Mineralization
Intravital Multiphoton Imaging of the Kidney: Tubular Structure and Metabolism
Stay updated, free articles. Join our Telegram channel
Full access? Get Clinical Tree