Esophageal motility disorders may be an explanation of dysphagia in patients after exclusion of esophageal structural lesions by endoscopy and radiography and eosinophilic esophagitis by histology. The best defined motility disorder is achalasia; however, other motility disorders such as diffuse esophageal spasm (DES), hypercontractile esophagus, and absent or weak peristalsis have also been reported with dysphagia.
Esophageal manometry characterizes the contractility of the esophagus to identify and classify motility disorders. High-resolution manometry (HRM) with esophageal pressure topography (EPT) analysis is now the method of choice to assess esophageal contractile function. These techniques were initially described by Clouse in the 1990s. The concept of HRM is to overcome the limitations of conventional manometric systems by using advanced electronic technologies. The key to this development involved vastly increasing the number of pressure sensors on the manometric assembly. Pressure sensors are placed with sufficient proximity to each other so that, by interpolating between adjacent sensors, intraluminal pressure can be viewed as a continuum along the length of the entire esophagus and adjacent sphincters. When HRM is coupled with improved sensor design, such that each sensor is circumferentially sensitive and capable of high-fidelity recordings, it also overcomes the fidelity and directionality limitations inherent in conventional water-perfused systems. The final technological advance that facilitated the widespread application of HRM to clinical manometry was the development of sophisticated plotting algorithms to display the hugely expanded manometric data set as colored EPT plots rather than as a multitude of overlapping line tracings. Together, these developments facilitate dynamic imaging of intraesophageal pressure as a continuum along the length of the esophagus with pressure magnitude depicted by spectral color. Fig. 1 depicts the typical pressure topography of both sphincters and the entire length of intervening esophagus during a swallow. The relative timing of sphincter relaxation, segmental esophageal contraction, as well as the position and length of pressure troughs between segments, are all readily demonstrated.
The use of intraluminal impedance to monitor the bolus movement within the gastrointestinal (GI) tract was first described by Silny in 1991. The technique is based on measurement of electrical impedance between closely placed electrodes mounted on an intraluminal probe. Impedance between each electrode pair depends on the nature of the luminal contents surrounding the electrodes. When the esophagus is empty, the impedance reflects the conductivity of the esophageal mucosa. Otherwise, it is indicative of surrounding intraluminal air (high impedance) or liquid (low impedance). With multiple pairs of impedance rings along the lumen of the esophagus, the spatial distribution and movement of air or liquid within the esophagus can be detected. Validation studies have verified that intraluminal impedance measurement has a high sensitivity and accuracy for tracking intraesophageal bolus movement and monitoring reflux. However, it is important to note that the technique is not sensitive to the volume of the bolus or refluxate; 1.0 mL of residue potentially yields the same signal as 10 mL.
In conjunction with HRM, impedance monitoring allows tracking the swallowed bolus in relation to EPT. Although the impedance data are ideally also displayed in a topographic format, the validated criteria for bolus presence within a segment is of a 50% decrease in impedance while a 50% increase toward the baseline value correlates with bolus exit. Swallows can then be classified as having complete bolus transit if bolus entry is seen at the most proximal site and bolus exit is recorded in all distal impedance-measuring sites, or incomplete bolus transit, if bolus exit is not identified at one or more of the distal impedance-measuring sites.
Achalasia
Achalasia is both the best-defined esophageal motor disorder and the one with the most specific treatment, making its accurate identification a key objective of clinical manometry. The manometric criteria for diagnosing achalasia are incomplete lower esophageal sphincter (LES) relaxation and absent peristalsis. One of the greatest gains realized with HRM over conventional manometry has been in refining the definition of both of these criteria, with the net effect of greatly improved accuracy in the identification of the varied contractile patterns of achalasia.
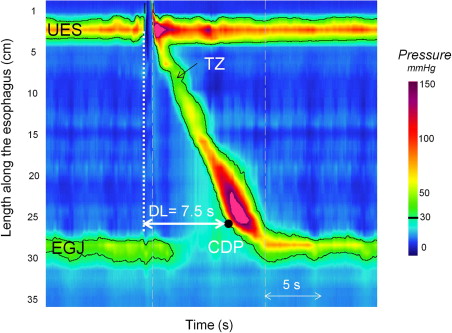
It is a common misconception that the LES (esophagogastric junction [EGJ]) normally relaxes completely to intragastric pressure after swallowing. In fact, this is distinctly unusual and even abnormal. Rather, the EGJ relaxes to a value that is close to intragastric pressure for a certain amount of time during the post-deglutitive period. Considerable effort has been expended in using EPT to define more precisely these vague terms of “close to intragastric pressure” and “certain amount of time.” Deglutitive EGJ relaxation occurs at a fixed time and place on EPT plots. Fig. 2 illustrates the location and relaxation of the sphincter during bolus transit relative to the pharyngeal swallow. In most instances, EGJ relaxation is measured in the region spanning from 2 cm above the proximal aspect of the EGJ at rest to the proximal stomach for a 10-second period commencing with upper esophageal sphincter (UES) relaxation. In the setting of normal peristalsis, the window terminates with the arrival of the peristaltic contraction, but in the setting of failed peristalsis, an arbitrary 10-second cutoff is established, and in the setting of a premature distal esophageal contraction, a very brief window of opportunity exists. Note that if sphincter elevation exceeds 2 cm, as evident by the position of the LES during the post-deglutitive contraction, the spatial limits for the measurement need to be adjusted accordingly. Once the spatial limits of the EGJ relaxation window are established, maximal EGJ pressure is then ascertained for each instant within the window—in essence, an e-sleeve measurement. The resultant data set then amounts to a history of EGJ residual pressure commencing at the instant of UES relaxation and ending either with the arrival of the esophageal contraction or 10 seconds later. However, it is overly simplistic to think of EGJ relaxation pressure as solely indicative of LES relaxation. Actually, at any one instant the e-sleeve pressure is the greatest of three possible contributions: LES pressure, crural diaphragm contraction, or intrabolus pressure as the swallowed water traverses the EGJ. Hence, the development of the EPT relaxation metric of the integrated relaxation pressure (IRP). The IRP is measured within the deglutitive window, capturing the axial movement of the LES and spanning from the time of initiation of the swallow until the arrival of the peristaltic contraction with the added stipulation that the relaxation pressure being reported represents the 4-second period of lowest EGJ pressure after the swallow (see Fig. 2 ). Table 1 illustrates the added yield of the IRP compared to the nadir LES or EGJ pressure in the detection of impaired EGJ relaxation in a series of well defined achalasia patients. This is of great significance because failing to detect impaired EGJ relaxation has the result of giving these patients an alternative diagnosis, most commonly misclassifying as ineffective esophageal motility or DES.

| EGJ Relaxation Measure | Achalasia Sensitivity (%) (n = 62) | False Negative (%) |
|---|---|---|
| Single sensor nadir (<7 mm Hg) | 52 | 48 |
| High-resolution nadir (<10 mm Hg) | 69 | 31 |
| 4-second integrated relaxation pressure (<15 mm Hg) | 97 | 3 |
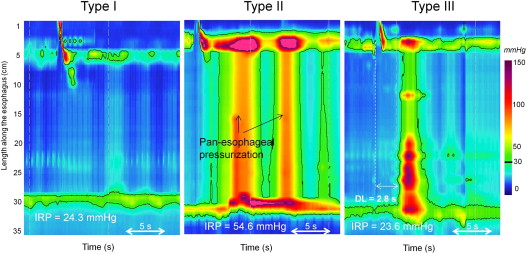
Apart from objectifying the definition of impaired deglutitive EGJ relaxation, EPT has also defined a clinically relevant subclassification of achalasia based on the pattern of “absent peristalsis” in the esophageal body. Absent peristalsis is not synonymous with an absence of pressurization or contractile activity. Rather, absent peristalsis accompanying impaired EGJ relaxation can occur in the setting of esophageal dilatation with negligible pressurization within the esophagus ( Fig. 3 A), pan-esophageal pressurization (see Fig. 3 B), or with some persistent contraction within the distal esophageal segment (see Fig. 3 C). According to the Chicago Classification of EPT, the criteria for type I (classic) achalasia are an IRP of 15 mm Hg or greater and absent peristalsis; type II (achalasia with esophageal pressurization) has an IRP of 15 mm Hg or greater and at least 20% of swallows associated with panesophageal pressurization to greater than 30 mm Hg; and type III achalasia has an IRP of 15 mm Hg or greater and either a spastic contraction or a preserved peristaltic fragment with 20% or greater of test swallows. Recent data suggest that classifying the etiology of the residual distal contraction in type III achalasia is best accomplished by measuring its latency relative to UES relaxation. Premature contractions (latency <4.5 seconds) are indicative of spastic achalasia whereas normal latency contractions suggest a fragment of preserved peristalsis in the esophageal body. To add some perspective to the distribution of subtypes encountered, in a series of 99 consecutive patients with newly diagnosed achalasia, 21 had type I, 49 had type II, and 29 had type III. Consequently, most of the patients in that series would not be diagnosed with achalasia according to a conventional manometric classification. The conventional diagnosis of “vigorous achalasia” (although it never had a precise definition) would likely include some cases of both type II and type III achalasia, diagnoses with nearly opposite implications, as detailed later.
The ultimate significance of identifying subtypes of achalasia is that it clarifies management, and preliminary data suggest this to be the case. Logistic regression analysis of predictors of treatment benefit in a large consecutive series found pan-esophageal pressurization (see Fig. 3 B) to be a predictor of good treatment response (dilation or myotomy) whereas spastic achalasia (see Fig. 3 C) and pretreatment esophageal dilatation were predictive of a relatively poor treatment response. Clearly, these nuances have not been utilized in prior reports of achalasia treatment outcomes. Given that the mix of achalasia subtypes within any reported case series likely impacts on the efficacy observed in that series, this calls into question the validity of the existing treatment data in the era of EPT. It is our suspicion that adopting these subclassifications will likely strengthen the quality of future prospective studies of achalasia management, although this clearly requires further validation.
The impedance characteristics of achalasia are, as one would predict, incomplete bolus transit. Although that finding is supportive of the physiologic defect associated with the disease, it has not as yet been shown to help in subtyping achalasia or in assessing the effectiveness of a rendered therapy.
EGJ Outflow Obstruction: Is it Achalasia?
Although EPT goes a long way toward clarifying the diagnosis in many achalasia patients who would otherwise be classified as “nonspecific” or misclassified to a non-achalasia diagnosis, there is still a group of patients with impaired EGJ relaxation failing to meet criteria for achalasia because they demonstrate some preserved peristalsis. Though not common, a series of 1000 consecutive patients studied with EPT included 16 such individuals with EGJ outflow obstruction exhibiting not only an IRP greater than 15 mm Hg, but also preserved peristalsis and elevated intrabolus pressure above the EGJ during peristalsis. The finding of elevated intrabolus pressure is important because it validates the determination of impaired EGJ relaxation. From a physiologic perspective, elevated intrabolus pressure is the consequence of that impaired relaxation. Nonetheless, EGJ outflow obstruction represents a heterogeneous group with some individuals having an incomplete expression of achalasia and others likely having an undetected mechanical cause of EGJ outflow obstruction such as hiatus hernia or esophageal stenosis. Consequently, it is a patient group that usually merits further intensive evaluation with imaging studies to exclude inflammatory or malignant etiologies, be that with computerized tomography or endoscopic ultrasound, before accepting it to be atypical achalasia.
Among the 16 patients with idiopathic EGJ outflow obstruction described in the preceding text, 3 were noted to have hiatus hernias. In one of these instances it was the crural diaphragm rather than the LES that appeared to be the focus of resistance to bolus transit, suggesting this be the cause of dysphagia. A subsequent report specifically focused on the EGJ relaxation characteristics of patients with sliding hiatus hernia and dysphagia by selectively restricting the IRP measurement boundaries to the LES and crural diaphragm individually. A subset of 10 patients were found exhibiting a relative obstruction at the crural diaphragm with elevated intrabolus pressure extending through the LES, supporting the concept that sliding hiatus hernia could be responsible for dysphagia. Consequently, patients presenting with elevated EGJ relaxation pressure in the context of a small hiatus hernia require careful analysis of the discrete elements of the EGJ before a diagnosis of achalasia is made.
Related posts:
 A 21st Century Look at the Spectrum of Gastrointestinal Motility Disorders. What is Dysmotility; What is Functional?
Enteric Neuromuscular Pathology Update
Postoperative Problems 2011: Fundoplication and Obesity Surgery
A 21st Century Look at the Spectrum of Gastrointestinal Motility Disorders. What is Dysmotility; What is Functional?
Postoperative Problems 2011: Fundoplication and Obesity Surgery
A 21st Century Look at the Spectrum of Gastrointestinal Motility Disorders. What is Dysmotility; What is Functional?
Enteric Neuromuscular Pathology Update
Postoperative Problems 2011: Fundoplication and Obesity Surgery
A 21st Century Look at the Spectrum of Gastrointestinal Motility Disorders. What is Dysmotility; What is Functional?
Postoperative Problems 2011: Fundoplication and Obesity Surgery
 Challenges in the Swallowing Mechanism: Nonobstructive Dysphagia in the Era of High-Resolution Manometry and Impedance
Stay updated, free articles. Join our Telegram channel

Full access? Get Clinical Tree


