Fig. 1
The three steps to “biopsychronology.” In a first step a fine needle biopsy is taken (shown is an example of a rat kidney). The second step consists of an incubation of the kidney biopsy with live stains . Stains can vary, depending on the cell parameters, being analyzed. In this case the biopsy was stained with Syto16 (in green, staining all the nuclei), propidium iodide (PI, in red, staining the nuclei of the nonvital cells), and wheat germ agglutinin (WGA, in violet, staining the tissue morphology of the kidney sample). In the third step real-time live confocal analysis with a spinning disc system is performed. Due to the spinning disc technology, the confocal analysis can be performed with non-fixed biopsy samples. If a whole kidney biopsy is taken, serial pictures at low magnification can be assembled for overview purposes. From low magnifications (see bottom left corner showing images acquired with a 4×, 10×, and 20× objective) to a more detailed analysis of regions of interest using higher magnifications as exemplified with a 40× water immersion objective (see two examples at the top left and bottom right corner of the figure) can easily be performed. (Reproduced from Transplant International 2014 27:868–876 with permission)
In order to confirm that our approach is suitable to monitor changes in the cellular environment, we analyzed rat kidney biopsies after a 24-h incubation step at 37 °C in the tissue culture incubator (24 h 37 °C) or following permeabilization of the cell membrane by digitonin treatment, which results in the collapse of cellular homeostasis and cell death. The pictures shown in Fig. 2 focus on the corticular area of the kidney and comprise several tubuli. Double staining with either Syto 16 (green) or PI (red; Fig. 2a–c) or TMRM (red) and WGA (green; Fig. 2b–d) documents the cell viability. Despite immediate processing of the samples (i.a.b) a heterogeneity in the staining pattern can be observed which documents the presence of viable and nonviable regions in the tubular area. After the 24-h incubation step at 37 °C, the number of PI-positive (dead) cells increases substantially, while only a fraction of Syto 16 positive/PI negative cells is still present at the end of the incubation period. After the digitonin addition all nuclei are PI/Syto 16 positive resulting in a yellow overlay color. A similar picture emerges when looking at the mitochondrial membrane potential. At the earliest time point after the biopsy areas with decreased mitochondrial function are already detectable (Fig. 2b). Finally, the mitochondrial transmembrane potential has completely collapsed after the permeabilization of the cell membrane by digitonin (Fig. 2f).
Fig. 2
Real-time live confocal imaging of the corticular area of a kidney biopsy showing several tubuli. Following left renal ischemia/reperfusion (IR) (35 min) fine needle biopsies of murine kidneys were taken and incubated with live stain s . (a and c) Syto 16 (green), propidium iodide (PI; red) visualizing nuclei of living (Syto 16) and dead cells (PI), and (b and d) wheat germ agglutinin (WGA, green) and TMRM (red), staining cell membranes and functional mitochondria. Images were acquired with a 40× water immersion objective. One representative example is shown consisting of a z-stack of 25 planes with a spacing of 1 μm
The staining pattern obtained with WGA showed the same heterogeneity as did the staining with TMRM. After cultivation for 24 h at 37 °C, the structural integrity of the biopsy was lost and increased cell death was apparent as documented by Syto16/PI staining. Permeabilization with digitonin finally resulted in massive cell death (Fig. 2c and d) but has no influence on the staining pattern of WGA (Fig. 2d).
In order to demonstrate the suitability of our method to monitor the status of a graft prior to transplantation, murine kidneys were exposed to 24 h of cold ischemia. Following this, longitudinal biopsies were taken and incubated with Syto 16 (green), propidium iodide (PI; red), and WGA. Figure 3 shows the result of such a staining documenting the viability in a tubular area before (left image) and after 24 h of cold ischemia (right image).
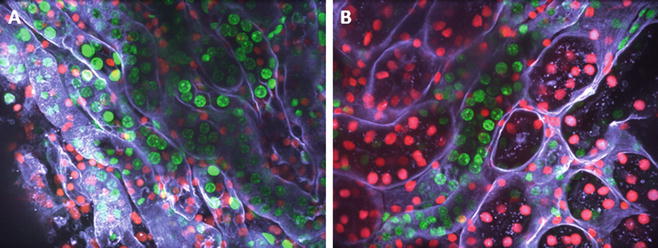
Fig. 3
Real-time live confocal imaging of the corticular area of a kidney biopsy. Following left renal IR (35 min) fine needle biopsies of murine kidneys were taken and incubated with the live stains Syto 16 (green), propidium iodide (PI; red), and wheat germ agglutinin (WGA, white), to stain all nuclei, nuclei of the dead cells, and cell membranes, respectively. Left image shows a tubular area, the right image a tubular area after 24 h of cold ischemia. Images were acquired with a 40× water immersion objective. Shown is a z-stack of 25 planes with a spacing of 1 μm
2 Materials
2.1 Animal Experimentation
2.
Surgical microscope.
3.
Anesthetic gas evaporator.
4.
Isoflurane.
5.
Sterilized surgical instruments (forceps, scissors, surgical clamp holder).
6.
Bipolar coagulation forceps.
7.
Bipolar coagulation generator.
8.
Nontraumatic vascular clamps.
9.
Skinsept.
10.
Underpads.
11.
Gauze.
12.
Transpore tape.
13.
Autoclave unit.
14.
Syringes.
15.
Needles.
16.
Preservative solution, e.g., HTK (Histidine-tryptophan-ketoglutarate).
17.
Falcon™ tubes.
18.
Surgical gloves.
19.
Saline.
20.
Hair trimmer.
2.2 Biopsy Acquisition and Culture
1.
Super-core semi-automatic biopsy needle (18 g × 9 cm) (Angiotech, Stenlose, Denmark).
2.
Scalpels/blades.
3.
Forceps.
4.
Fine scissors.
5.
Petri dishes.
6.
Pipette set.
7.
 Propagation and Culture of Human Renal Fibroblasts
 Isolation and Primary Culture of Murine Podocytes with Proven Origin
 An In Vitro Murine Model of Vascular Smooth Muscle Cell Mineralization
 Renal Sympathetic Denervation in Rats
 The Isolation and Quantitation of Fetuin-A-Containing Calciprotein Particles from Biological Fluids
 Intravital Multiphoton Imaging of the Kidney: Tubular Structure and Metabolism


Pipet aid.
Related posts:
Propagation and Culture of Human Renal Fibroblasts
Isolation and Primary Culture of Murine Podocytes with Proven Origin
An In Vitro Murine Model of Vascular Smooth Muscle Cell Mineralization
Renal Sympathetic Denervation in Rats
Intravital Multiphoton Imaging of the Kidney: Tubular Structure and Metabolism
Stay updated, free articles. Join our Telegram channel
Full access? Get Clinical Tree
