(1)
Department of Vascular Surgery, Evangelisches Krankenhaus Königin Elisabeth Herzberge, Berlin, Germany
The use of prosthetic material for an AV access is indicated, if:
1.
There are no suitable veins for an AV fistula.
2.
The expected period of time required before the AV fistula is ready for puncture exceeds 6–8 weeks or is not predictable with the patient already needing hemodialysis.
3.
The comparatively more complex surgery using native vessels (e.g., transposition of the arterialized basilic vein of the upper arm) might not be worthwhile if the patient’s life expectancy is limited.
The certain availability and the defined dimensions are definite advantages of prosthetic grafts. The disadvantages of all prosthetic materials, however, are their higher thrombogenicity and their susceptibility to infection. The shunt experience presented in this book exclusively concerns vascular ePTFE prostheses produced by the Impra/Bard company.
4.1 Pathophysiology
From a functional point of view, AV shunts have three segments:
Arterial anastomosis
Puncturable segment
Venous anastomosis
4.1.1 Arterial Anastomosis
As with AV fistulas, the proximal part of the artery dilates depending on flow, duration of use, and other individual factors. In contrast to veins, the resistance of prostheses is determined by their metrics, and does not change over the course of time. The dilation of an afferent artery feeding an AV shunt prosthesis is usually less pronounced than that of an artery feeding a native AV fistula. There is however an increase in shunt flow as well because of a diminishing inflow resistance. A lateroterminal anastomosis between a small diameter artery (e.g., 3–4 mm) and large diameter prosthesis (e.g., 7–8 mm) will result in an effective stenosis in 5–35 % (Fig. 4.1a, Asif et al. 2005; Bozof et al. 2008; Choudhury et al. 1995).
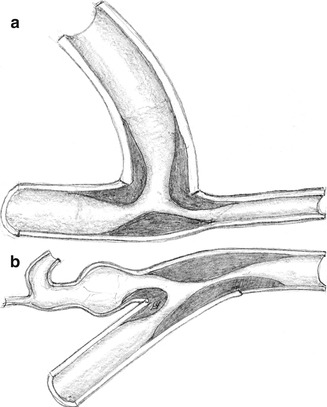
Fig. 4.1
Stenosis at the (a) arterial and (b) venous anastomosis
If a narrow (4-mm) graft segment is used at the anastomosis, we have not seen a stenosis in more than 4,000 AV shunts over the last 30 years. In the inflow region of the prosthesis a thrill originates, which is caused by low frequency pressure changes (20–50 Hz) and which can also be palpated. This thrill can be noted over the whole length of the prosthesis up to the venous anastomosis and sometimes even beyond; sometimes it is also found in the proximal and distal segments of the artery.
4.1.2 Puncturable Segment
Depending on the time that has passed since implantation and additional individual factors, there is a varied migration of fibroblasts from outside the wall of the ePTFE prosthesis into its lumen. Each puncture destroys the local structure of the prosthesis. At the puncture sites, connective tissue (sometimes with capillaries) sprouts into the lumen. With multiple punctures close to each other, the whole wall structure of the affected area will be destroyed, leaving mainly scar tissue behind. It is in such areas that aneurysms with wall-adherent thrombi will develop.
4.1.3 Venous Anastomosis
Thrombosis is the most frequent complication of AV grafts. Most frequently it is due to a stenosis of the venous anastomosis caused by hard connective tissue proliferation (Fig. 4.1b).
4.1.4 Tissue Proliferation Inside the AV Shunt
When performing redo surgery, tissue proliferation concerning both anastomoses and the inside of the prosthetic graft can be observed. Irrespective of its location it almost always looks the same. It is a hard, partially callous, grayish-white tissue. In the literature it is frequently referred to as intimal hyperplasia or pseudointima. From a pathogenetic perspective there are three distinct forms as discussed below (Fig. 4.2).
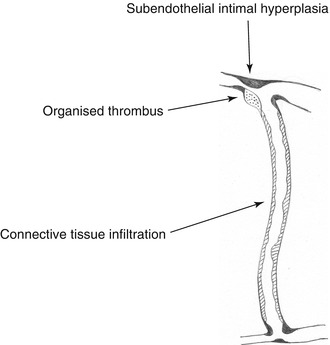
Fig. 4.2
Predilection sites for intravasal tissue proliferation
Anastomotic Region of Artery and Vein
Tissue proliferation in this area is likely to be caused by hemodynamic irritation. Intimal hyperplasia is not a suitable term, as this implies hyperplasia of the whole intima consisting of both endothelium and basement membrane. Histology, however, shows a proliferation between endothelium and basement membrane. Therefore we prefer to call this phenomenon subendothelial fibrosis or subendothelial intimal hyperplasia (SIH). That is what it will subsequently be referred to.
Dead Water Zones Around the Anastomosis
Dead water zones of the vessel are areas which are hardly perfused. Due to the slow or stagnating flow, coagulation is activated locally. These zones are most frequently observed with ill-dimensioned anastomoses in the prosthetic part of the venous anastomosis. Thrombotic material will be transformed into connective tissue, which macroscopically resembles the material described above. The term “pseudointima” is misleading, as it is organized thrombotic material.
Prosthesis
After varying periods of time following implantation, frequently circular wall adhesions of hard, grayish-white matter can be observed within ePTFE prostheses. Histologically it is connective tissue. This material, which is also difficult or impossible to remove, can be found everywhere in the prosthesis, even in areas which have not been punctured. The pore size of a prosthesis offers no barrier against the cellular migration from outside. This phenomenon may preferably be characterized as connective tissue infiltration.
4.2 Hemodynamics of Arteriovenous Grafts
The following morphologic and functional differences exist between a prosthetic AV graft and an AV fistula:
The metrics of the anastomotic aperture are defined with prosthetic grafts. (A venous anastomosis tends to dilate in the course of time.)
The flow resistance of a prosthesis is determined by its metrics. Conversely the flow resistance of a vein decreases following its dilation.
When using prosthetic grafts, there is an additional terminolateral anastomosis between prosthesis and vein.
Mostly there is a primarily higher flow in a prosthetic AV shunt than in an AV fistula.
This leads to even more unphysiological flow conditions with grafts at both the arterial and the venous anastomoses. According to the literature (Fillinger et al. 1990; Fung and Liu 1993; Hofstra et al. 1995; Lemson et al. 2000; Liepsch 1989, 1998; Longest and Kleinstreuer 2000; Ojha et al. 1995; Shu and Hwang 1991; Sivanesan et al. 1999; Sottiurai 1990; Tordoir 1999; Zarins et al. 1996) the following hemodynamic conditions favor tissue proliferation in the anastomotic region:
Elevated and permanently changing shear of the vascular wall
Oscillations of the flow (pulse synchronous change of flow direction with new orientation of the endothelium)
Changing pressure load of the venous wall,
Secondary flow
Dead water zones at the venous anastomosis
The extent of this unphysiological flow depends on the flow rate. Animal experiments have shown that the degree of a stenosis increases with increasing flow rates (Fillinger et al. 1990). In the region of a sudden pressure drop (Figs. 4.3 and 4.4a), flow disturbances arise which lead to vibrations that are transmitted perivascularly (Fillinger et al. 1990). Palpation of this thrill is recommended to verify the proper functioning of an AV access for hemodialysis (Richman and Wilson 1991).
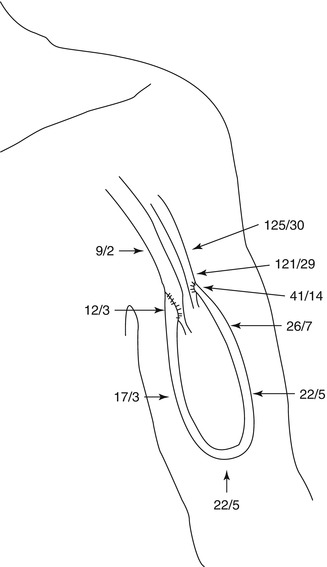
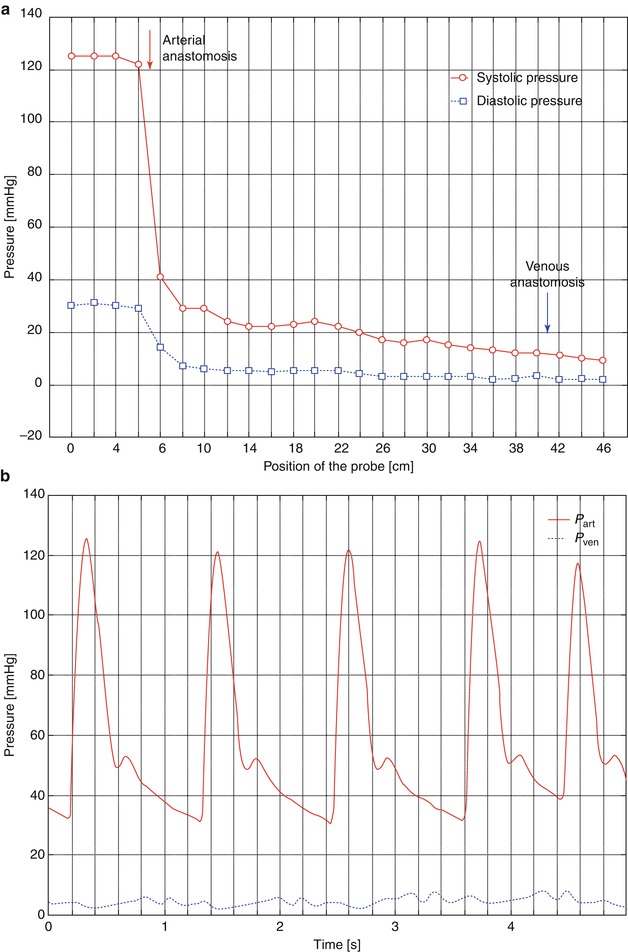
Fig. 4.3
Pressure gradient inside a loop graft (mmHg)
Fig. 4.4
(a) Pressure gradient inside a loop graft: pressure dependent on the position of the probe. It is introduced at the apex of the loop and then advanced up to the arterial lumen. Then the venous side of the loop is examined in the same way. For the sketch we assumed a continuous process (i.e., probe-carrying catheter starts in the artery and ends in the vein). (b) Pressure inside the artery and 5 cm downstream from the venous anastomosis (same patient as in a). In the vein there is a slight pulsation, too
In the following, the results of flow dynamic measurements and numerical simulations from the arterial to the venous anastomoses of AV interposition grafts are presented.
4.2.1 Pressure Curves Within an AV Interposition Graft
The aorta and the large arteries determine around 19 % of the resistance of the entire vascular system whilst terminal arteries, arterioles, and capillaries define 75 % (Affeld and Kertscher 2011; Schmidt and Thews 2000). This entails a pressure drop in the venous system to less than 10 mmHg.
The presence of an AV access almost excludes the pressure-lowering part of the vascular system. The high energy of the arterial system directly reaches the venous low pressure system. Figure 4.3 shows the pressure readings within a loop-shaped AV shunt of the upper arm depending on the position of the pressure probe. There is a rapid decrease in pressure within the graft. Already 1 cm downstream from the arterial anastomosis, the systolic pressure drops to a third of its initial value. Figure 4.4 shows the corresponding pressure curves. Pulsation of the venous pressure can still be observed several centimeters downstream from the venous anastomosis.
4.2.2 Influence of the Sudden Change of Diameter Between a Narrow Artery and a 7-mm Prosthesis on Blood Flow
In the literature, the incidence of stenoses of the arterial anastomoses ranges from 5 to 35 % (Asif et al. 2005; Bozof et al. 2008; Choudhury et al. 1995). These stenoses are mainly caused by SIH. We investigated the influence of a sudden change of diameter between an artery and a prosthesis following the clinical observation of a stenosis in the transition zone between a 3-mm artery and a 7-mm prosthesis (Huhle et al. 2002; Krueger et al. 2004).
The typical flow patterns between a 4-mm artery and a 7-mm prosthesis are depicted in Fig. 4.5. Figure 4.6 shows the same situation with an additional narrow intercalated 4-mm segment upstream from the 7-mm prosthesis.
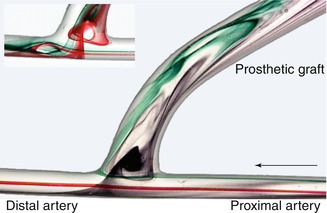
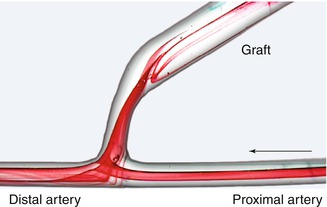
Fig. 4.5
Flow visualization with direct anastomosis of a small caliber artery and a large caliber prosthesis. The arrow marks the direction of the inflow
Fig. 4.6
Flow visualization with interposition of a narrow segment (length 10 mm) between a small lumen artery and a large lumen graft
The experiments were conducted using a pulsatile flow system as described in the literature (Petzold 2001; Huhle 2002; see Chap. 21). The metrics of the models corresponded to those of straight interposition grafts of the upper arm. The diameters of artery and vein varied over a wide range. For the figures we present here, we selected a 7-mm prosthesis and a 4-mm artery. The narrow segment started with a diameter of 4 mm which conically merged into the prosthesis. Dye injection helped visualize flow patterns. For better illustration an (atypical) flow rate of 100 mL/min was chosen. Higher flow rates do not change the flow patterns, but their visualization using a freeze image is more difficult and thus less obvious.
Without the narrow segment between the artery and the interposition graft, the following typical flow patterns arise (Fig. 4.5):
At the entry of the prosthesis a vortex develops whose expansion and rotational speed increases with an increasing flow rate. This vortex’s rotation slows down as it drifts towards the proximal anastomotic angle during diastole (lower part of Fig. 4.5, slightly altered position of the injection needle).
Maximum flow velocity is prevalent in the central stream which runs from the proximal to the distal artery. Only a few millimeters downstream from the distal anastomotic margin, a partial backflow develops during systole (as can be seen on the arterial floor). This backflow induces a deflection of the central stream towards the anastomotic aperture at the distal anastomotic angle.
The lateral stream on the arterial floor runs into the distal artery. During systole its collision with the backflow fraction of the central stream leads to its perpendicular deflection from the arterial floor to the entry of the prosthesis. The point of impact of this lateral stream shifts distally during diastole. It also shows pronounced pulse-synchronous oscillations.
Both phenomena increase as the difference in diameter between the artery and the interposition graft increases.
If a narrow segment (length 4 mm, diameter 10 mm) is inserted between artery and graft, the following changes of flow phenomena occur (Fig. 4.6):
The vortex at the entry into the prosthesis near the anastomotic aperture vanishes.
In the region of the conical widening of the prosthesis, a stationary vortex develops due to the flow detachment from the prosthetic wall.
The oscillating changes in flow direction on the arterial floor diminish considerably. (The reasons are the altered metrics of the anastomosis.)
Lengthening of the narrow segment does not entail a different quality of the flow patterns (Krueger et al. 2001).
The narrow segment reduces unphysiological flow in the anastomosis. The flow oscillations on the arterial floor diminish while the vortex at the entry vanishes. Both phenomena reduce the strain on the arterial endothelial cells.
4.2.3 Influence of the Design and Length of a Graft on Flow Rate
The knowledge of the influence of the prosthesis length on shunt flow is clinically important. For our experiments on the influence of the design and length of a graft prosthesis we used a model pulsatile flow system as shown in Fig. 4.7. For these experiments, the arterial anastomosis did not have a narrow segment. Straight pipes with diameters of 5, 6, and 7 mm connected the arterial to the venous model anastomosis. The pipes’lengths varied from 10 to 50 cm. To simulate loop grafts we placed the pipes in bent mountings with radii of curvature of 30, 45, or 60 mm. We used two different models with arterial diameters of either 4 or 7 mm.
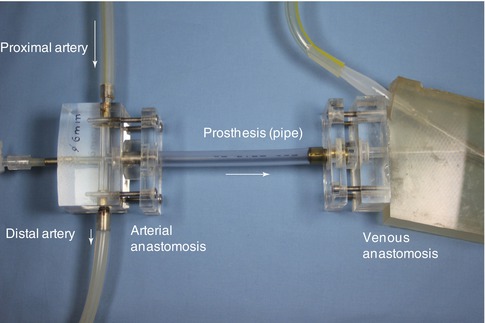
Fig. 4.7
Setting for investigating the influence of graft length on shunt flow rate. The length of the pipe varied from 10 to 50 cm
Figure 4.8 shows a summary of the readings at a mean pressure of 100 mmHg. The readings of respective combinations of arterial diameters and interposition grafts were related to a standardized pipe length of 10 cm. The curve in Fig. 4.8 illustrates that the length of an interposed graft hardly influences the shunt flow. With 7-mm prosthetic grafts the maximum mean flow hardly changes for increasing lengths of the grafts (curves 3 and 6). A prosthetic diameter of 5 mm influenced length-dependent shunt flow more than other diameters (curves 1 and 4). Still the impact remains small, showing a decrease in flow of only 13 % as the respective lengths change from 10 cm to 50 cm. In a clinical situation a 5-mm prosthesis to a 7-mm artery would be highly unlikely. With the most frequently used 7-mm prostheses, the influence of their lengths on flow rates in the interposition graft may be neglected.
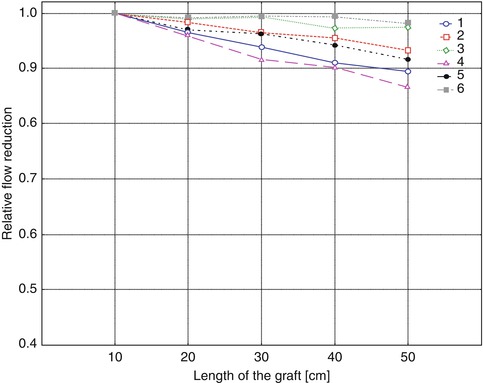
Fig. 4.8
Relative flow reduction dependent on the length of a straight AV graft. For curves 1–3 the arterial diameter was 4 mm, but 7 mm for curves 4–6. Graft diameters were 5 mm (curves 1 and 4), 6 mm (curves 2 and 5), and 7 mm (curves 3 and 6)
In comparison with a straight graft, a loop does not change the flow rate. Even a decrease of the radius of curvature from 60 to 30 mm changes the flow by less than 1 % (mean of all readings under three different arterial pressures, and combinations of diameters as described above). Therefore we do not show these results. The influence of the length of a prosthesis on flow characteristics that might favor thrombosis was not examined.
4.2.4 Venous Anastomosis
Progressive stenoses of the venous anastomosis are the most frequent causes of prosthetic access failure. We have examined the flow in the venous anastomosis for different constellations:
1.
Comparison between a conventional terminolateral anastomosis and a prosthetic anastomosis whose venous side shows a bulb-shaped patch design (patch prosthesis/patch anastomosis; Fig. 4.32 ).
2.
Finding the adequate patch size for different venous diameters.
3.
Not or incorrectly trimmed patch prosthesis.
4.
Influence of a venous side branch near the anastomosis (ligation recommended?)
5.
Influence of the angle between prosthesis and vein.
6.
Influence of inflow radius with loop grafts.
7.
High grade stenosis on the venous floor of a conventional terminolateral anastomosis (starting point for further stenoses of the venous runoff path?)
For these examinations we used both transparent silicone casts in the pulsatile flow system and numerical simulations (Chap. 21). There were identical boundary conditions:
Duration of the pulsatile cycle: 1 s (corresponds to a pulse rate of 60 min−1).
Prosthesis entry: systolic flow rate 1,500 mL/min with Reynolds number Re 1,389, and mean flow 700 mL/min with Re 648.
The distally-directed venous outflow is one-third of the inflow into the prosthesis. Two-thirds remain for the centrally-directed venous outflow. This flow distribution mirrors a frequent situation found in vivo. It is caused by increasingly insufficient distal venous valves with ensuing venous dilatation (Gordon 1996).
Fluid characteristics: density ρ = 1.1 g/cm3, dynamic viscosity η = 3.6 mPa∙s.
Comparison Between a Conventional Terminolateral Anastomosis and a Patch Anastomosis
Since 1998 an ePTFE prosthesis (Bard, Inc) with a patch area for the venous anastomosis that we developed has been available. Hereafter we refer to it as patch prosthesis.
Visualization of the Flow in a Pulsatile Flow System
The observed flow patterns are highly complex. Figures 4.9 and 4.10 summarize their main characteristics. After entry into the recipient vein, the flow is diverted to the venous outer wall in both models (conventional and patch anastomosis). In the conventional anastomosis a stagnation point occurs (Fig. 4.9a).
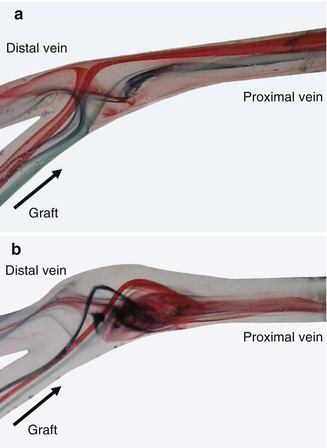
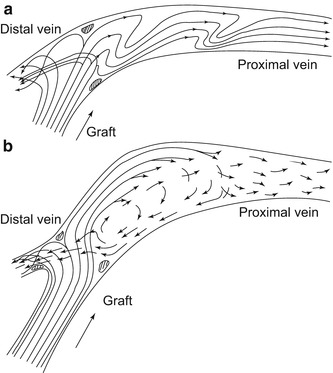
Fig. 4.9
(a) Flow visualization in a conventional terminolateral anastomosis. (b) Flow visualization in a patch anastomosis
Fig. 4.10
(a) Flow pattern in a convetional venous anastomosis. (b) Flow pattern in a patch anastomosis
There the flow is divided according to the configuration (one-third distally, two-thirds proximally). The location of the stagnation point is time-dependent. During the acceleration phase it moves upstream towards the distal vein. During diastole it moves downstream to the proximal vein. In the patch anastomosis, the flow is also divided, but there is no stagnation point (Fig. 4.9). Its main characteristic is the flow detachment from the venous wall and the development of a large vortex whose rotational speed is slow. This vortex keeps its sense of rotation during the entire simulated cycle without oscillations of the flow. The mixing of the dyes indicates a better wash out effect, which leads to a calmed down outflow in the proximal vein. Size and location of the vortex depend on the flow rate. As a result a significant reduction or disappearance of the thrill may also be observed clinically with patients (Petzold 2001).
Numerical Simulation
The numerical simulations were carried out with a non-Newtonian fluid (Cross 1965). The viscosity at zero shear rate was defined as 120 mPa∙s, and the infinite shear rate viscosity at 3.6 mPa∙s. Furthermore, the vessel walls were defined by their no slip condition: zero velocity at the walls (see Chap. 20).
Compared to the other pictures of the venous anatomosis, the results of the numerical simulation are shown vertically mirrored. The lowest readings are shown in dark blue, and the highest in red. If not stated otherwise, the flow is shown at the systolic maximum, as then the differences between the anastomotic configurations are most pronounced. The side of the prosthesis which faces the vein is called the inner side. The floor of the vein lies opposite to the entry into the prosthesis.
Distribution of Velocity in the Symmetry Plane
With both anastomotic configurations the main flow is deflected to the proximal vein according to the flow distribution. As the visualization is restricted to the symmetry plane, Fig. 4.11a renders only a limited impression of the complexity of the flow. The symmetry plane is the plane that yields two mirrored halves of the model. Once again a stagnation point can be seen directly on the floor of the vein, where the flow is divided into a proximal and distal portion. The highest velocities are at the venous floor. The stagnation point migrates during the simulated heart cycle. During the acceleration phase it moves downstream, and in diastole distally. By contrast, the distribution of velocities in the patch anastomosis is much more harmonious on the floor of the recipient vein (Fig. 4.11). Between the floor of the venous wall and the jet stream marked in yellow there is a narrow band of low velocities. This indicates a distinctively lower shear at the venous wall. There is no stagnation of the flow (dark blue). After entry into the anastomosis the flow is detached from the venous wall while forming a vortex. This vortex persists during the entire simulated heart cycle (Fig. 4.12) without further flow oscillations and leads to an improved wash out effect.
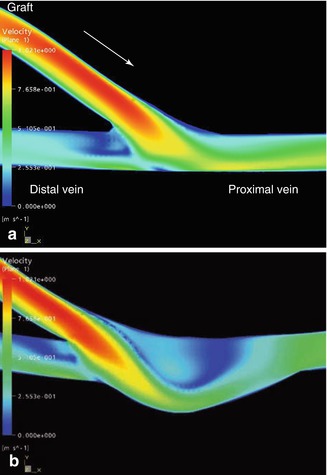
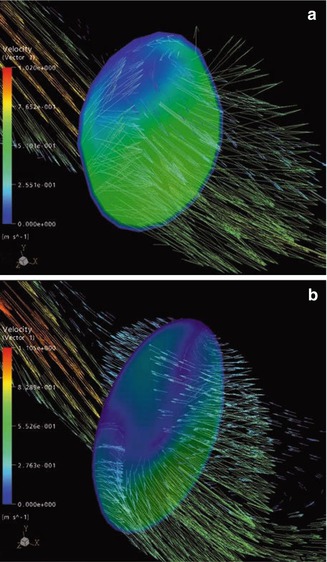
Fig. 4.11
(a) Velocity distribution in a conventional terminolateral anastomosis. The arrow marks the direction of the inflow (valid for all figures in Sect. 4.2.4, and for all vessel denominations unless stated otherwise). (b) Velocity distribution in a patch anastomosis
Fig. 4.12
(a) Velocity vectors in a conventional anastomosis. These vectors originate from a cross section area perpendicular to the venous floor in the middle region of the anastomosis. (b) Velocity vectors originating from the cross section area in a patch anastomosis
Velocity Vectors
A cross section area perpendicular to the venous floor is the origin of these vectors in the middle of the conventional anastomosis in Fig. 4.12a. The vectors demonstrate the formation of a secondary flow (Chap. 20) perpendicular to the main flow. The direction of the vectors changes with the ongoing cycle. Thus an additional stimulus would be exerted on the venous endothelium (change of flow direction) in vivo. In the patch anastomosis, the 3D shape of the said vortex is depicted in Fig. 4.12b.
Static Pressure in the Symmetry Plane
The figures show the distribution of the relative static pressure in the anastomotic regions. The normalized static pressure is set to that of the proximal exit for comparison. Thus only the increase in pressure caused by the flow deceleration is depicted. In the conventional anastomosis, there is a local pressure maximum on the venous floor (Fig. 4.13a). Also taking into account the velocity distribution (Fig. 4.11a), it becomes clear that here a flow stagnation occurs. The kinetic energy of the flow is transformed into local pressure strain on the venous wall (for estimates of the absolute values see Chap. 20). In the patch anastomosis, the increase in pressure is much less pronounced. The enlarged anastomotic space can accommodate the high energy flow and conduct it to the vortex described above (Fig. 4.13b).
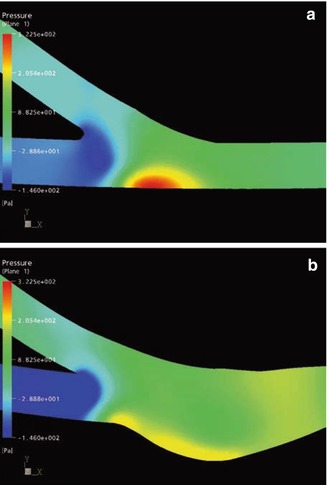
Fig. 4.13
Pressure distribution (a) in a conventional anastomosis and (b) in a patch anastomosis
Wall Shear Stress
Figure 4.14 shows the distribution of the wall shear stress. This stress is distinctly lower in the patch anastomosis (Krueger et al. 2002). The highest readings may be found in the conventional anastomosis on the floor of the recipient vein. They correspond to the high velocities of the proximal outflow (Fig. 4.11a).
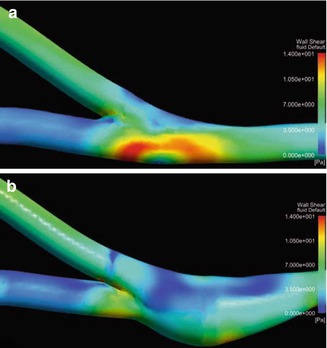
Fig. 4.14
Distribution of the wall shear stress (a) in a conventional anastomosis and (b) in a patch anastomosis
Results of the Experiments Comparing a Conventional Terminolateral Anastomosis to a Patch Anatomosis
The bulb-shaped design of a patch anastomosis offers the following advantages over a conventional anastomosis:
Better wash out effect of the anastomotic space.
Calmed down outflow into the proximal vein.
Less pressure strain on the venous wall in the anastomotic space.
Lower shear stress.
No flow oscillations (flow reversal) at the wall.
Investigations Concerning the Adaptation of the Patch Size to the Venous Diameter
In the pulsatile flow system we examined several constellations with different patch sizes and venous diameters between 3 and 9 mm so as to prove the advantages mentioned above as criteria for the correct anastomotic design. The findings show that only a patch whose dimensions are adapted to the respective venous diameter yields optimum hemodynamic results (no extra diagram). The lines printed on the commercially available ready-to-use patch graft exploit the results of these experiments to make the ideal trimming possible (Fig. 4.40).
Investigations Concerning Anastomoses with Not or Incorrectly-Trimmed Patches
The desired effects of a patch anastomosis are closely linked to the correct design (size) of the patch which determines its hemodynamic characteristics. It is almost always necessary to trim the patch prosthesis. The diameter of the vein when it is dilated to the max determines the cut. A mismatched patch or a patch whose trim is too blunt cannot adopt the desired bulb-shaped, harmoniously tapering configuration, but results in an undesirably hooded anastomosis between the prosthetic patch and the vein (Figs. 4.14, 4.15, 4.16, 4.17, and 4.18).
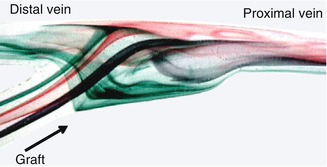
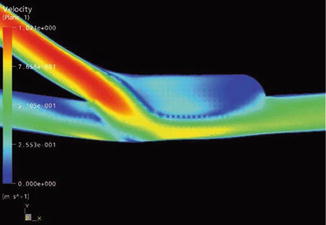
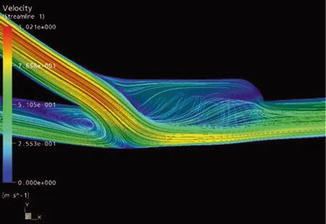
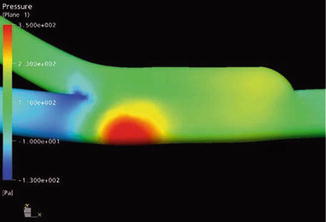
Fig. 4.15
Flow visualization in a hooded patch anastomosis
Fig. 4.16
Velocity distribution in a hooded patch anastomosis
Fig. 4.17
Stream lines in a hooded patch anastomosis
Fig. 4.18
Pressure distribution in a hooded patch anastomosis
Visualization of the Flow in a Pulsatile Flow System
We recreated an untrimmed model patch prosthesis. As with the conventional terminolateral anastomosis, there is a stagnation point (Fig. 4.15). The vortex detected in this kind of patch anastomosis is reduced. In the hooded region, the dye remains for a long time (dead water zone; Chap. 20). Dead water zones are known to be regions where thrombi preferentially form. The impact of the blood flow on the exterior venous wall is comparable to that in a conventional anastomosis. The stress on the venous wall is not reduced.
Numerical Simulation
In a hooded patch anastomosis, velocities at the venous floor are higher than in a correctly-trimmed anastomosis (Fig. 4.16). In the hood the flow becomes separated from the outer wall. The resulting vortex is smaller than in correctly-trimmed patch prostheses. It only persists during systole. During the entire heart cycle, velocities are rather low (dead water zone). The stream lines (Fig. 4.17) show that there is only sparse movement. At the outer wall of the hood the fluid comes to a standstill. Figure 4.18 shows the pressure distribution at the anastomotic wall. The local pressure maximum on the venous floor corresponds to that of a conventional anastomosis. It results from the strong impact of the flow on the venous wall. The desired calming down of the flow does not occur.
The precise harmonious trimming of the prosthetic patch is essential in order to obtain the desired hemodynamic advantages.
Influence of a Venous Side Branch Close to the Anastomosis
The clinical observation that leaving a venous side branch may cause a high-grade stenosis near the venous anastomosis prompted our investigations of this situation in the model pulsatile flow system (Fig. 4.19). The results of the numerical simulations confirmed the results obtained in the circular flow system (Figs. 4.20 and 4.21). Both methods recorded hemodynamics in the anastomosis when the side branch was either open or closed. While the flow with a closed side branch (Figs. 4.19a and 4.21a) corresponds to the flow in an undisturbed patch anastomosis, (cf. Figs. 4.9b, 4.11b, and 4.14b), a totally different hemodynamic situation arises with an open venous side branch near the anastomosis (Figs. 4.19, 4.20, and 4.21b). It is characterized by:
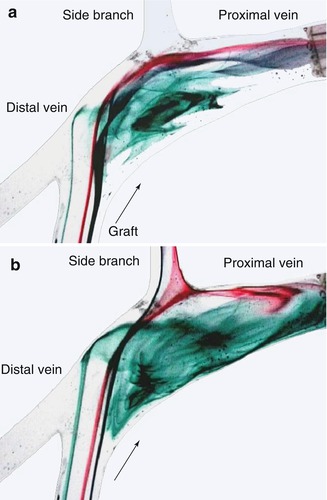
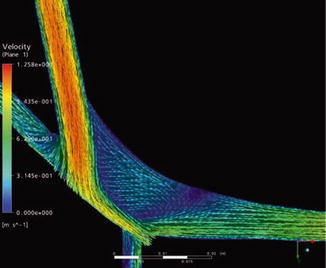
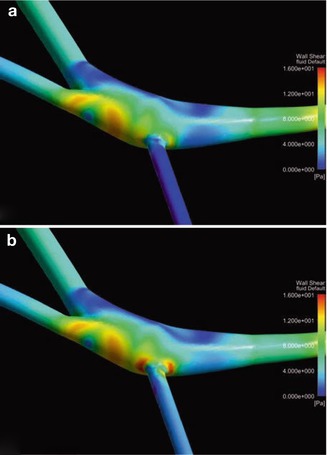
Fig. 4.19
Flow visualization in a patch anastomosis (a) with a closed side branch and (b) with an open side branch
Fig. 4.20
Velocity vectors in a patch anastomosis with an open side branch
Fig. 4.21
Distribution of the wall shear stress in a patch anastomosis (a) with closed side branch and (b) with open side branch
Disappearance of the bulb function.
Lack of a calmed down flow.
Occurrence of dead water zones.
Impact of the main flow on the venous wall flow at the ostium of the side branch.
Increased wall shear stress exerted on the venous wall at the ostium of the side branch.
These mechanical irritations favor subendothelial intimal hyperplasia.
Venous sidebranches near the anastomosis should be ligated.
Investigations on the Angle Between Prosthesis and Vein
With terminolateral anastomoses, the anastomotic angle influences hemodynamics (Staalsen et al. 1995). For investigations on the influence of the inflow angle between prosthesis and vein, we produced a model with an acute angle between the patch anastomosis and the vein (Fig. 4.22a).
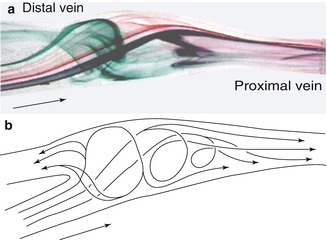
Fig. 4.22
(a) Flow visualization and (b) flow patterns in a patch anastomosis with an acute angle between graft and vein
An acute angle leads to the harmonization of the flow in the anastomosis. Again a large vortex becomes visible that persists over the entire simulated cardiac cycle and does not change its rotation. Small portions of the lateral flow (green) hit the venous wall during systole, divide, and flow both distally and laterally. The velocities of the flow portions close to the wall are considerably smaller than those of the central stream. That is why their impact is not critical. Over the course of the heart cycle all flow portions are deflected in a proximal direction and either directly follow the venous outflow or feed the large vortex from which the distal outflow originates during diastole (Fig. 4.22).
An acuter anastomotic angle leads to more physiologic flow changes.
Investigation of the Inflow Radius in Loop Grafts
The flow takes a different course when it is submitted to a radial acceleration in a curve (Munson et al. 1994). Inertia and centrifugal forces deflect the central flow to the outside, whereas at the inner side of the curve the central flow becomes detached. Furthermore there are secondary flows which are superimposed on the longitudinal flow. A picturesque description of this phenomenon can be found with aerial views or maps of meandering rivers like the Moselle (Chap. 20). These flow phenomena also occur in AV loops. The inflow radius of the graft as related to the vein influences the flow in the anastomosis. Figure 4.23 illustrates the term inflow radius. Figure 4.23a depicts a prosthesis with a small radius joined to the vein. The most expressed curvature is close to the anastomosis, whereas in Fig. 4.23b there is an expressed curvature directly downstream from the arterial anastomosis, but close to the vein the prosthesis shows a large radius. The angle between the vein and the venous end of the prosthesis (anastomotic angle) was the same in both situations for numerical simulations.
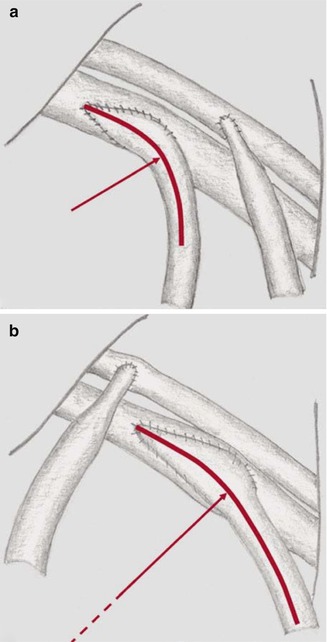
Fig. 4.23
Definition of the term “inflow radius”. (a) Subclavian loop with a narrow inflow radius of the graft into the vein. (b) Wide inflow radius
Velocity Vectors in the Symmetry Plane
In a small inflow radius prosthesis, a strong impact of the main flow on the venous floor can be observed at the systolic maximum. According to the preset flow division, the flow is directed mainly proximally. When entering the anastomosis there is a flow separation from the anastomosis, which persists during the whole cycle. Where the flow separation occurs there is also a retrograde flow. There are noteworthy flow portions directed to the inside of the anastomosis which originate from the impact area of the main flow on the venous floor. In contrast, in a large inflow radius prosthesis, a gentle deflection of the main flow into the anastomotic space and further into the proximal vein can be seen (comparable to Figs. 4.11a and 4.12b).
Pressure Load in the Symmetry Plane
Figure 4.24b shows the relative pressure distribution with regard to the proximal outlet of the anastomotic wall. Again a high strain at the systolic maximum can be seen. This maximum corresponds to the point of impact of the main flow. It shows a stagnation point.
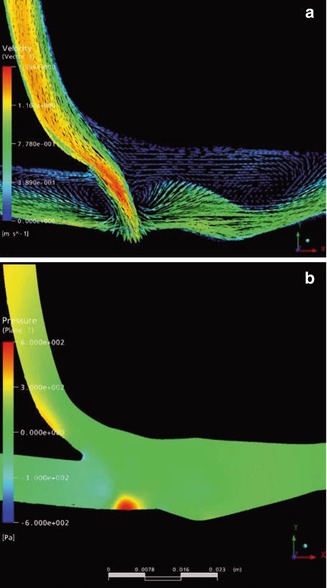
Fig. 4.24
(a) Velocity distribution within a narrow inflow radius anastomosis. The impact of the main flow on the venous floor is well visible. (b) Pressure load in a narrow influx. The site of maximum pressure corresponds to the impact site of the main flow.
Wall Shear Stress
In the small radius anastomosis, the wall shear stress is elevated over a larger area and a longer period of time especially at the sharp curvature and on the floor of the distal outflow path (Krüger and Scholz 2008).
The inflow radius of loop grafts should be as large as possible. A small inflow radius counteracts the advantages of a patch anastomosis.
Influence of a Pre-existing Stenosis in a Terminolateral Anastomosis on the Outflow Path
The mechanisms why multiple stenoses develop in the venous outflow path are not totally clear (Fig. 4.25). In the pulsatile flow system with a stenosis near the venous anastomosis of the silicone models, considerably altered flow patterns could be seen. In order to investigate the influence of these flow patterns on the formation of further stenoses, two configurations were numerically simulated:
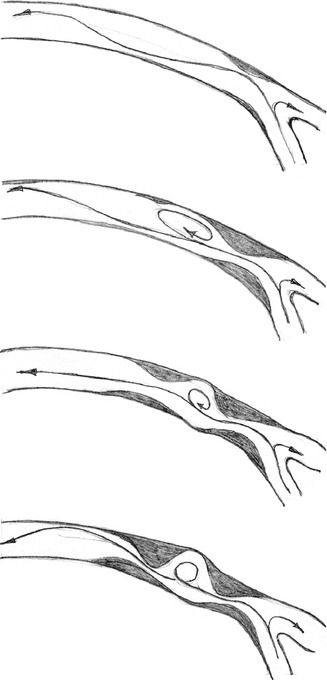
Fig. 4.25
Development of a second stenosis downstream from a pre-existing high-grade stenosis in the proximal venous outflow path
A conventional terminolateral anastomosis (reference).
The same anastomosis with an additional 77 % stenosis at the venous floor.
We compared the flow downstream from the venous anastomosis. Therefore we changed the boundary condition at the inlet to facilitate the recognition of clear differences.
The systolic flow was set to 2,200 mL/min (Re = 2,037) and the mean flow to 1,000 mL/min (Re = 926). Based on these Reynolds numbers the flow was still laminar (cf. Chap. 20).
The velocity distribution at the systolic maximum in the conventional anastomosis and in the proximal vein are shown in Fig. 4.26a (symmetry plane). A jet stream hits the venous floor and divides into two portions (cf. Fig. 4.11a). The main flow leaves via the proximal vein (two-thirds of the total flow; see boundary conditions in the introduction to Sect. 4.2.2). The angle between the inner wall of the vein and the prosthesis is too large to prevent the flow detachment from the inner wall. Consequently a backflow zone appears. Apart from these unphysiological characteristics near the anastomosis, no other disturbances can be found in the course of the venous efflux. The farther the distance from the anastomosis becomes, the calmer the flow pattern seems.
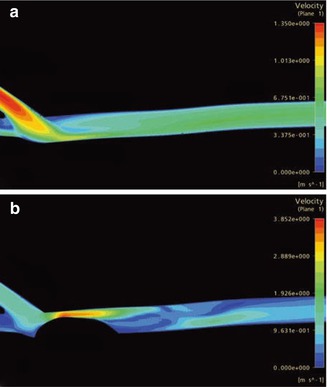
Fig. 4.26
(a) Velocity distribution in a conventional anastomosis and the proximal vein. (b) Velocity distribution in a conventional highly stenotic anastomosis and the procimal vein (different scale than a)
Conversely, a pre-existing stenosis on the venous floor changes the flow within the vein decisively (Fig. 4.26b). Within the stenosis the maximum velocity is three times as high as the maximum velocity in an anastomosis without a stenosis. (Note the different scales in Fig. 4.26a, b). Here the poststenotic velocity distribution is highly disturbed. In several regions flow separation occurs. Oscillating backflows and vortices consequently develop. Figure 4.27 shows the velocity vectors in the symmetry plane downstream from the stenosis at different points in time (a: start of systole, b: 40 ms later, c: 200 ms later). The poststenotic vortex on the venous floor can be seen in Fig. 4.27b. The vectors mark the retrograde flow. The change of the flow direction at the inner wall of the vein can be seen in Fig. 4.27c. Whereas there is an early orthograde flow (Fig. 4.27a, b) in this region, it later turns back and shows no further changes till the end of diastole.
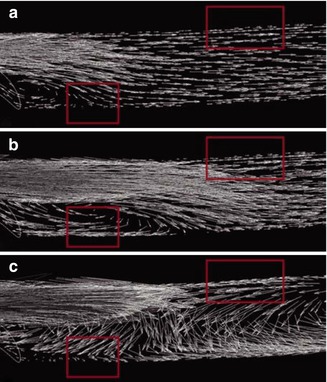
Fig. 4.27
Velocity vectors downstream from a stenosis. The stenosis reaches the left margin of the image. (a) Start of systole. (b, c) Velocity vectors downstream from the stenosis: (b) 40 ms after start of systole, (c) 200 ms after start of systole
A pre-existing stenosis in the venous anastomotic region considerably changes flow patterns in the poststenotic area. The alterations of the flow direction during a heart cycle as well as the regions with high oscillating wall shear stress (not shown) can cause further poststenotic lesions of the venous wall (Krueger et al. 2009).
4.2.5 Evaluation of the Results
The results prove the significant influence of geometry on the hemodynamics of anastomoses. Several authors report on the formation of SIH in the venous anastomosis (Fillinger et al. 1990; Lemson et al. 2000; Shu and Hwang 1991; Heise et al. 2011). In these studies, maximum SIH always occurred on the venous floor opposite the entry into the prosthesis. Various in vitro studies and numerical simulations showed a high velocity stream portion (jet stream) that hit the venous floor (Longest and Kleinstreuer 2000; Shu and Hwang 1991). The enlargement of the anastomotic space can decrease the strain on the venous floor and in particular the wall shear strain (Figs. 4.14 and 4.12). This approach led to the development of a patch prosthesis (Scholz et al. 1999a, b). The advantages of a patch prosthesis over a prosthesis with a standard venous anastomosis have been confirmed several times (Berard et al. 2003; Escobar et al. 1999; Lau et al. 2007; Liu et al. 2006; Nyberg et al. 2001; Sorom et al. 2002; Tsoulfas et al. 2008; Ko et al. 2009; Kan et al. 2009).
There are conflicting views concerning wall shear stress and its influence on SIH formation Some authors emphasize the correlation between low shear stress and SIH in arteries (e.g., Bassiouny et al. 1992; Lemson et al. 2000; Salam et al. 1996; Staalsen et al. 1995; Zarins et al. 1996). They consider this kind of hyperplasia an “adaptive response” of the arteries to the low shear rates which normalizes the shear near the wall (Zarins et al. 1996). The effective wall shear rates were around 0.5 Pa (Salam et al. 1996). Other authors, however, are convinced that high shear rates cause SIH (Sottiurai 1990; Hofstra et al. 1996; Haruguchi and Teraoka 2003; Kleinstreuer 2006), especially in AV interposition grafts (Fillinger et al. 1990) and veins used as arterial bypass grafts (e.g., Heethaar 1993; Lemson et al. 2000; Thubrikar 2007). There wall shear stress values were around 10 Pa (calculated from the presented hemodynamic data with blood viscosity of 3.6 mPa∙s; Fillinger et al. 1990). The respective wall shear rates for SIH formation in arteries and veins thus show more than a tenfold difference.
Related posts:


Stay updated, free articles. Join our Telegram channel

Full access? Get Clinical Tree


