Fig. 5.1
(a–d) Total, calculated free, calculated bioavailable testosterone (T), and LH (log. transformed) levels as a function of obesity classes. Data are expressed as mean (95% confidence interval). BMI body mass index. Insets indicate the age and chronic disease score index adjusted data. Data were obtained in a consecutive series of 1,715 subjects attending our Unit seeking medical care for sexual dysfunction between 2000 and 2011
Type 2 Diabetes Mellitus
Cross-sectional studies have demonstrated an association between low T and type 2 diabetes mellitus (T2DM) since the early 1980s [7, 15–17]. Recently, Anderson et al. [18], in a large series of 6,457 male patients aged 18–80 years with diabetes, demonstrated that 4.4% of them were frankly hypogonadal with a serum total testosterone of less than 8.0 nmol/L (∼230 ng/dL). For borderline hypogonadism (serum total testosterone 8–11.99 nmol/L (∼230–345 ng/dL)) the proportion of T2DM in men rose to 32.1%. In line with these data, two independent meta-analyses [19, 20] indicated that total T was significantly lower in men with T2DM. As a corollary, longitudinal data have demonstrated that low T predicts incident diabetes [20]. Inversely T2DM, obesity, and MetS predict forthcoming hypogonadism [19]. Although the direction and the dimension of the association between low T and T2DM have to be further investigated, current recommendations of most important academic societies [21, 22] consider T2DM as a risk factor for male hypogonadism. The specific mechanisms involved in the pathogenesis of T2DM-associated hypogonadism are complex and have not been fully elucidated. In line with the data observed in obesity, Dhindsa et al. [23] reported that in T2DM, androgen deficiency is commonly associated with an impaired gonadotropin response, leading to hypogonadotropic hypogonadism.
Hypertension
Epidemiological evidence regarding the association between T levels and hypertension is conflicting. Androgens have been attributed to the development and severity of hypertension in some genetic and nongenetic rat models [24, 25]. In rats that are hypertensive but not obese, androgens increase their blood pressure [26, 27]. However, contrasting findings have been reported in epidemiological trials. In particular, some studies have shown reduced androgen levels in subjects with essential hypertension, as compared to normotensive subjects [28, 29] while other investigators could not replicate this result [30]. In subjects with sexual dysfunction and MetS studies did not demonstrate any significant contribution of the hypertensive condition to male hypogonadism [31]. Conversely, there was an inverse relationship between SHBG-bound and unbound testosterone levels and pulse pressure, a surrogate marker of arterial stiffness [32]. Similar results were previously reported by Fogari et al. [33] in a consecutive series of 356 nondiabetic, nonsmoking, non-obese men aged 60–80 years and untreated for hypertension. These results suggest that in elderly men with systolic hypertension the reduced plasma levels of T may contribute to increased arterial stiffness. The mechanisms underlying these T effects remain unclear. Recent studies suggest that insulin resistance may be the common pathogenetic link between low T and arterial stiffness (see below [7]).
Dyslipidemia
Evidence has demonstrated inconsistent associations between reduced T levels and abnormal lipid profiles. Initial studies demonstrated increased total cholesterol, low density lipoprotein (LDL), and triglyceride (TG) levels among hypogonadal patients with improvements noted following supplementationW [34, 35]. With long-term androgen deprivation (12 months) among patients with prostate cancer, increases in total LDL, high density lipoprotein (HDL), and TG have been noted, while shorter term studies have demonstrated conflicting results with LDL and increases in HDL and total cholesterol [36–38]. Further studies have demonstrated no differences in HDL, LDL, total cholesterol, or TG levels [39–41].
Metabolic Syndrome
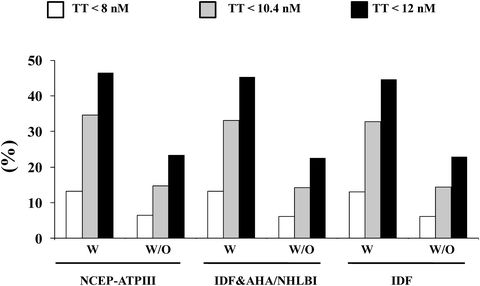
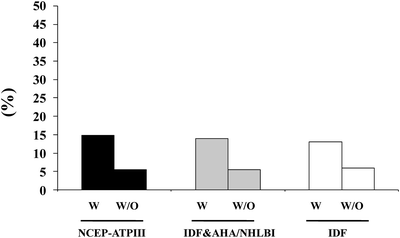
A large body of evidence suggests that male hypogonadism is frequently associated with MetS [9, 12, 31, 42]. Meta-analyses of available epidemiological reports revealed that MetS is significantly associated with an overall lower total T [42, 43], the difference being more evident in studies conducted in subjects with ED (−3.51[−4.48; −2.53]) than in those without ED (−2.60[−3.15; −2.06]) [42]. In subjects consulting our outpatient clinic for sexual dysfunction the proportion of subjects identified as having hypogonadism and MetS ranges from about 13% to more than 46%, according to various biochemical thresholds of T deficiency (TD) (see Fig. 5.2). Interestingly, whatever the definition of MetS or TDs (total T lower than 8, 10.4, or 12 nmol/L) is used the relative fraction of hypogonadal subjects identified by MetS does not change. Recent data from the European Male Aging Study (EMAS), a population-based survey of more than 3,400 men enrolled across eight European centers, demonstrated that among many symptoms, sexual issues (ED, reduced libido, and decreased spontaneous erections) were the most specific for TDs [44]. By applying these EMAS-derived criteria (simultaneous presence of three sexual symptoms and T < 11 nmol/L), there was a significant association with MetS (see Fig. 5.3).


Fig. 5.2
Prevalence of hypogonadism according to different total testosterone thresholds in patients with (W) and without (W/O) different metabolic syndrome (MetS) definitions. Data are derived from a consecutive series of 2,481 patients attending our unit for sexual dysfunction between 2000 and 2011. NCEP-ATPIII National Cholesterol Education Program-Third Adult Treatment Panel, IDF International Diabetes Federation, AHA/NHLBI American Heart Association/National Heart, Lung and Blood Institute

Fig. 5.3
Prevalence of hypogonadism (according to EMAS hypogonadism definition) in patients with (w) and without (w/o) MetS. Data are derived from a consecutive series of 2,481 patients attending our unit for sexual dysfunction between 2000 and 2011. NCEP-ATPIII National Cholesterol Education Program-Third Adult Treatment Panel; IDF International Diabetes Federation; AHA/NHLBI American Heart Association/National Heart, Lung and Blood Institute
Pathogenesis of MetS-Related Hypogonadism
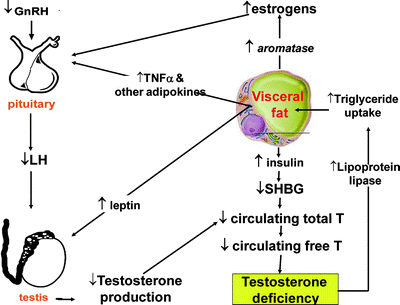
The vicious cycle between MetS and hypogonadism is summarized in Fig. 5.4. The androgen receptor is highly expressed in visceral fat and negatively regulates the differentiation of preadipocytes into mature adipocytes [45]. In addition, androgens decrease fat mass by regulating the differentiation of mesenchymal stem cells to adipocytes [46]. In humans, T acutely inhibits oleic acid uptake in omental and retroperitoneal tissues acting through lipoprotein lipase, but not subcutaneous, adipose tissue [47]. A mixed (primary and secondary) Hypogonadal state develops, with the adverse consequence of obesity. Which molecules are responsible for inhibiting the compensatory increase of GnRH/LH in obesity-induced T decline is still unknown, but reasonable candidates are estrogens, insulin, leptin, TNFα, or other adipokines [7, 9, 10, 12, 48].


Fig. 5.4
Proposed interactions between increased visceral fat and hypogonadism. TNFα tumor necrosis factor α; T testosterone (adapted from Buvat J, Maggi M, Gooren L, et al. Endocrine Aspects of Male Sexual Dysfunctions. Journal of Sexual Medicine 2010;7(4):1627-1656, with permission from John Wiley & Sons, Inc.)
Hypogonadism can be observed in animal models of insulin-deficient diabetes suggesting a possible role of insulin in regulating hypothalamus GnRH synthesis and release [49–51]. Accordingly, patients with T2DM and MetS, who are insulin resistant, showed a higher prevalence of hypogonadotropic hypogonadism [9, 23, 52, 53]. In addition, the increased conversion of T to estradiol by fat observed in obese men can reduce LH secretion, inducing a negative feedback on both the hypothalamus and pituitary. Accordingly, Loves et al. [54] previously reported that a weekly low dose of the aromatase inhibitor, letrozole, restored testosterone levels and increased LH levels in severely obese hypogonadal men.
Other evidence suggests that the testis could be less sensitive to gonadotropin stimulation in MetS. Pitteloud et al. [55, 56] demonstrated that human chorionic gonadotropin (hCG)-stimulated T levels were positively correlated with insulin sensitivity. Insulin itself is capable of stimulating T production while simultaneously, inhibiting SHBG concentration [57]. Hence, insulin resistance associated with obesity may contribute to the low T levels seen in obese men, due to a direct effect on the testis [55–57]. In addition, leptin exerts suppressive effects on testicular steroidogenesis and may contribute to further disruption of the pulse amplitude of GnRH [58, 59]. Finally, obesity is also associated with increased circulating TNFα levels, as a consequence of inflammatory cascade activation. Morales et al. [60] demonstrated that intratesticular TNFα delivery is associated with a blunted T response to hCG stimulation. TNFα can also inhibit LH release acting at both the pituitary and hypothalamic levels [61].
Epidemiological Association Between Testosterone and Cardiovascular Morbidity and Mortality
Despite the strong association between low T and well-known CV risk factors such as obesity, T2DM, and MetS, the relationship between CVD and serum T levels in men remains somewhat contradictory [7, 62]. Several studies have reported an association between androgen deprivation therapy for advanced prostate cancer and forthcoming CV diseases [63–66], suggesting a direct pathogenetic role of low serum testosterone. However, other reports did not confirm this association [67–70]. In addition, in a large series (n = 1,687) of subjects seeking medical care for sexual dysfunction, evaluated for up to 10 years, there was no association between incident major adverse cardiovascular diseases (MACE) and baseline T levels [71]. In the same study, however, low T, even in the overt hypogonadal range (below 8 nmol/L), was associated with an increased risk of MACE mortality [71]. In line with this data, low T has been associated with an increased mortality in patients affected by specific diseases, such as hypopituitarism [72], Klinefelter’s syndrome [73], mental retardation [74], and in specific populations, such as veterans [75], and Japanese men with at least one CV factor [76]. Studies performed in community-dwelling males, however, have provided conflicting results [77–94] (see also Table 5.1). A recent meta-analysis of the available population-based studies has shown that low endogenous T levels are associated with increased risk of all-cause and CVD death, but no association was observed between reduced T and incidence of CVD [62]. In addition, the same authors emphasized that there was a considerable between-study heterogeneity, which was related to study and subject characteristics, suggests that effects were driven by differences between cohorts (e.g., in underlying health status). Accordingly, meta-analysis of the available cross-sectional studies demonstrate that subjects with CVD have, on average, lower T levels than healthy controls [47]. Furthermore, several associated morbidities, such as diabetes, obesity, and hypertension, were associated with increased T differences between cases and controls, confirming numerous clinical observations. Taken together, these results suggest that low T may be considered as a marker of poor general health status, negatively affecting prognosis, rather than as a specific CV risk factor [47].
Table 5.1
Descriptive characteristics of the available community-dwelling studies evaluating the impact of testosterone levels on forthcoming cardiovascular morbidity and mortality
Study | Name | Age (years) mean ± SD (range) | Number of subjects | Follow-up (years) | Diagnosis of hypogonadism | CV morbidity | CV mortality |
|---|---|---|---|---|---|---|---|
Barrett-Connor and Khaw [77] | Rancho-Bernardo | 40–79 | 1,009 | 12.0 | TT as continuum | ↔ MACE | ↔ MACE |
Contoreggi et al. [78] | Baltimore longitudinal study of aging | 58.8 ± 10.0 | 170 | 9.5 | TT as continuum | ↔ IHD | NA |
34–87 | |||||||
Yarnell et al. [79] | Caerphilly study | 45–59 | 2,512 | 5.0 | Lowest quintile vs. higher quintilesa | ↔ IHD | NA |
Smith et al. [80] | Caerphilly study | 45–59 | 2,512 | 16.5 | Lowest quintile (TT < 16.1 nmol/L) vs. higher quintiles | ↔ IHD | ↔ IHD |
Ärnlöv et al. [81] | Framingham study | 56.0 ± 12.0 | 2,084 | 10.0 | Lowest quartile (TT < 11.5 nmol/L) vs. higher quartile | ↔ MACE | NA |
30–60 | |||||||
Abbott et al. [82] | Honolulu-Asia Aging study | 77.6 ± 4.6 | 2,197 | 6.0 | Lowest quintile (TT < 12 nmol/L) vs. highest quintiles | ↔ stroke | NA |
71–93 | |||||||
Araujo et al. [83] | Massachusetts Male Aging study | 40–70 | 1,686 | 15.3 | Lowest quintile (TT < 12.8 nmol/L) vs. highest quintiles | NA | ↔ MACE |
Lowest quintile (FT < 0.280 nmol/L) vs. highest quintiles | NA | ↓ IHD | |||||
Khaw et al. [84] | European Prospective Investigation into Cancer in Norfolk | 40–79 | 11,606a | 7.0 | Lowest quartile (TT < 12.5 nmol/L) vs. highest quartiles | NA | ↑ all causes of mortality |
↑ MACE | |||||||
Maggio et al. [85] | Aging in the Chianti Area study | 65–92 | 410 | 6.0 | BT < 2.43 nmol/L | NA | ↔ All causes of mortality |
Laughlin et al. [86] | Rancho-Bernardo | Median 73.6 | 794 | 11.8 | Lowest quartile (TT < 8.4 nmol/L) vs. highest quartiles | NA | ↑ All causes of mortality |
50–91 | Lowest quartile (BT < 2.7 nmol/L) vs. highest quartiles | NA | ↑ All causes of mortality | ||||
↑ MACE | |||||||
Lehtonen [87] | The health of Elderly men in the city of Turku, Southwest Finland | 71.5 | 187 | 10.0 | TT as continuum | NA | ↑ All causes of mortality |
Szulc et al. [88] | MINOS study | 65.4 | 782 | 10 | Lowest quartilea vs. highest quartiles | NA | ↔ All causes of mortality |
Tivesten et al. [89] | Swedish Osteoporotic Fractures in Men study | 75.0 | 3,014 | 4.5 | Lowest quartile (TT < 11.5 nmol/L) vs. highest quartiles | NA | ↑ All causes of mortality |
69–80 | Lowest quartile (FT < 0.14 nmol/L) vs. highest quartiles | NA | ↑ All causes of mortality
Stay updated, free articles. Join our Telegram channel
Full access? Get Clinical Tree
 Get Clinical Tree app for offline access

|


