Peritoneal dialysis is the method of renal replacement therapy used by about 200,000 patients worldwide. Since the introduction of continuous ambulatory peritoneal dialysis (CAPD) almost four decades ago and more recently of compact “easy-to-use” hydraulic cyclers for automated peritoneal dialysis (APD), the popularity of peritoneal dialysis has increased greatly. This is because peritoneal dialysis is simple, convenient, and relatively low cost, and because it can be done in the home.
I. WHAT IS PERITONEAL DIALYSIS? In essence, peritoneal dialysis involves the transport of solutes and water across a “membrane” that separates two fluid-containing compartments: (a) the blood in the peritoneal capillaries, which in renal failure contains an excess of urea, creatinine, potassium, and other waste products, and (b) the dialysis solution in the peritoneal cavity, which typically contains sodium, chloride, and lactate or bicarbonate and which is rendered hyperosmolar by the inclusion of a high concentration of glucose. During the course of a peritoneal dialysis dwell, three transport processes occur simultaneously: diffusion, ultrafiltration, and absorption. The amount of dialysis achieved and the extent of fluid removal depend on the volume of dialysis solution infused (called the dwell volume), how often this dialysis solution is exchanged, and the concentration of crystalloid osmotic or colloid oncotic agent present.
II. FUNCTIONAL ANATOMY
A. Anatomy of the peritoneal cavity. The peritoneum is the serosal membrane that lines the peritoneal cavity (Fig. 21.1). It has a surface area that is similar to body surface area, and so typically ranges from 1 to 2 m2 in an adult. The peritoneum is divided into two portions:
1. The visceral peritoneum, which lines the gut and other viscera
2. The parietal peritoneum, which lines the walls of the abdominal cavity
The visceral peritoneum accounts for about 80% of the total peritoneal surface area. It receives its blood supply from the superior mesenteric artery, and venous drainage is via the portal system. The parietal peritoneum, which may be more important in peritoneal dialysis, receives blood from the lumbar, intercostal, and epigastric arteries and drains into the inferior vena cava. Total peritoneal blood flow cannot be directly measured, but has been estimated to range from 50 to 100 mL/min. The main lymphatic drainage of the peritoneum and of the peritoneal cavity is via stomata in the diaphragmatic peritoneum, which ultimately drain via large collecting ducts into the right lymphatic duct. Additional drainage occurs via lymphatics present in both the visceral and the parietal peritoneum.
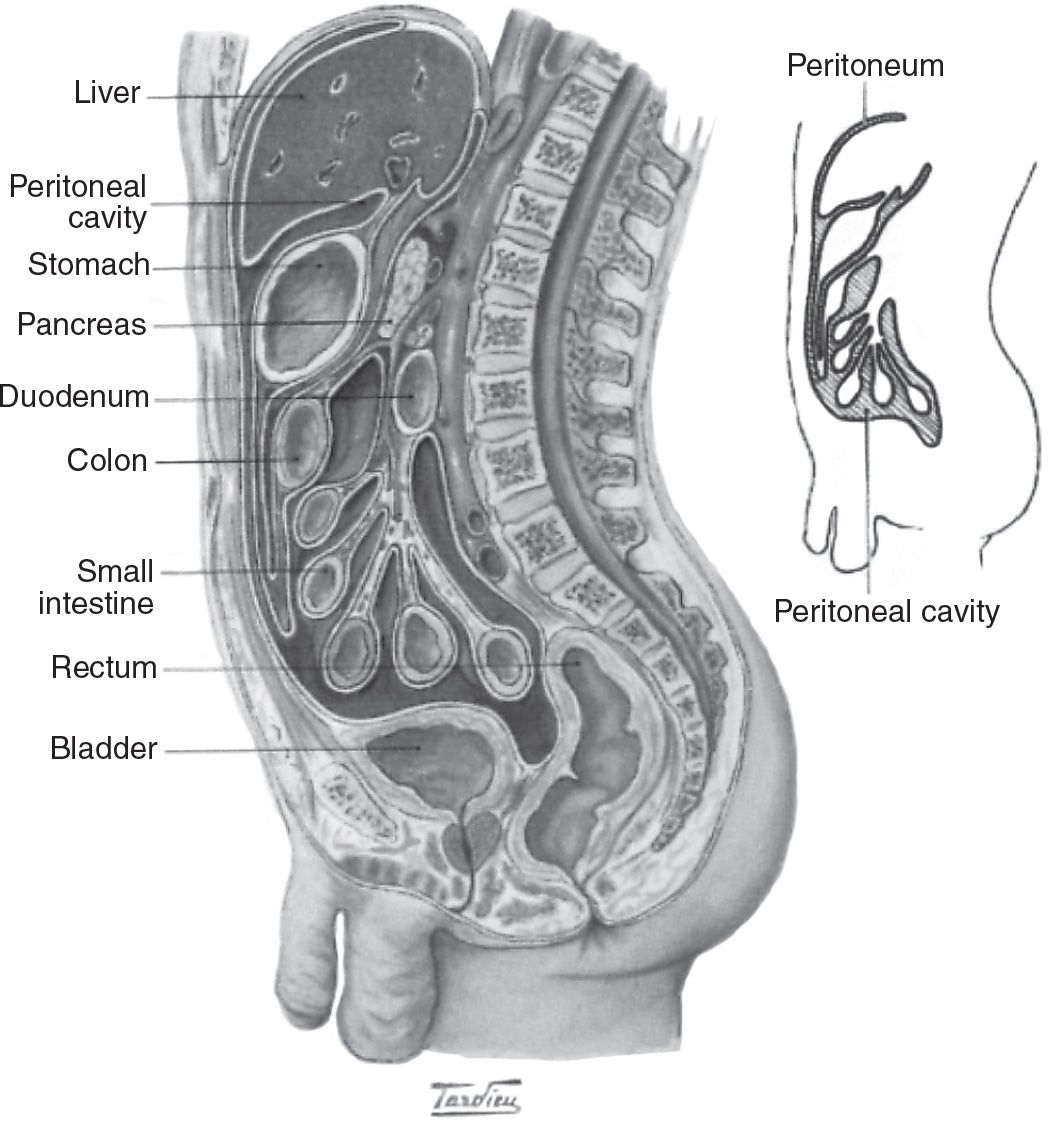
FIGURE 21.1 Simplified anatomy of the peritoneal cavity showing the visceral and parietal peritoneal membrane. (Adapted from Khanna R, et al., eds. The Essentials of Peritoneal Dialysis. Dordrecht: Kluwer; 1993.)
B. Peritoneal membrane histology. The peritoneal membrane is lined by a monolayer of mesothelial cells equipped with microvillae that produce a thin film of lubricating fluid. Underlying the mesothelium is the interstitium, which comprises a gel-like matrix containing collagenous and other fibers, the peritoneal capillaries, and some lymphatics.
C. Models of peritoneal transport. There are six regions of resistance to moving solute and water across the peritoneum from capillary blood to peritoneal fluid: (a) the stagnant capillary fluid film overlying the endothelium of the peritoneal capillaries, (b) the capillary endothelium itself, (c) the endothelial basement membrane, (d) the interstitium, (e) the mesothelium, and (f) the stagnant fluid film that overlies the mesothelium.
Of these, the two stagnant fluid films and the mesothelial cell are thought to offer only trivial resistance to transport. Two concepts of peritoneal transport are popular; they are complementary and not mutually exclusive, and they emphasize the importance of the peritoneal vasculature and the interstitium. They are the three-pore model and the distributed model.
1. The three-pore model. This model, which has been well validated by clinical observations, holds that the peritoneal capillary is the critical barrier to peritoneal transport and that solute and water movement across the peritoneal capillary is dependent on the relative abundance of pores of three different sizes (Fig. 21.2).
a. Large pores with a radius of 20–40 nm, are thought to be large clefts in the endothelium. Macromolecules, such as protein are transported by convection through these pores.
b. Small pores with a radius of 4–6 nm, likely represent smaller clefts between endothelial cells. The density of these small pores affects transport of small solutes such as urea, creatinine, sodium, and potassium, in association with water.
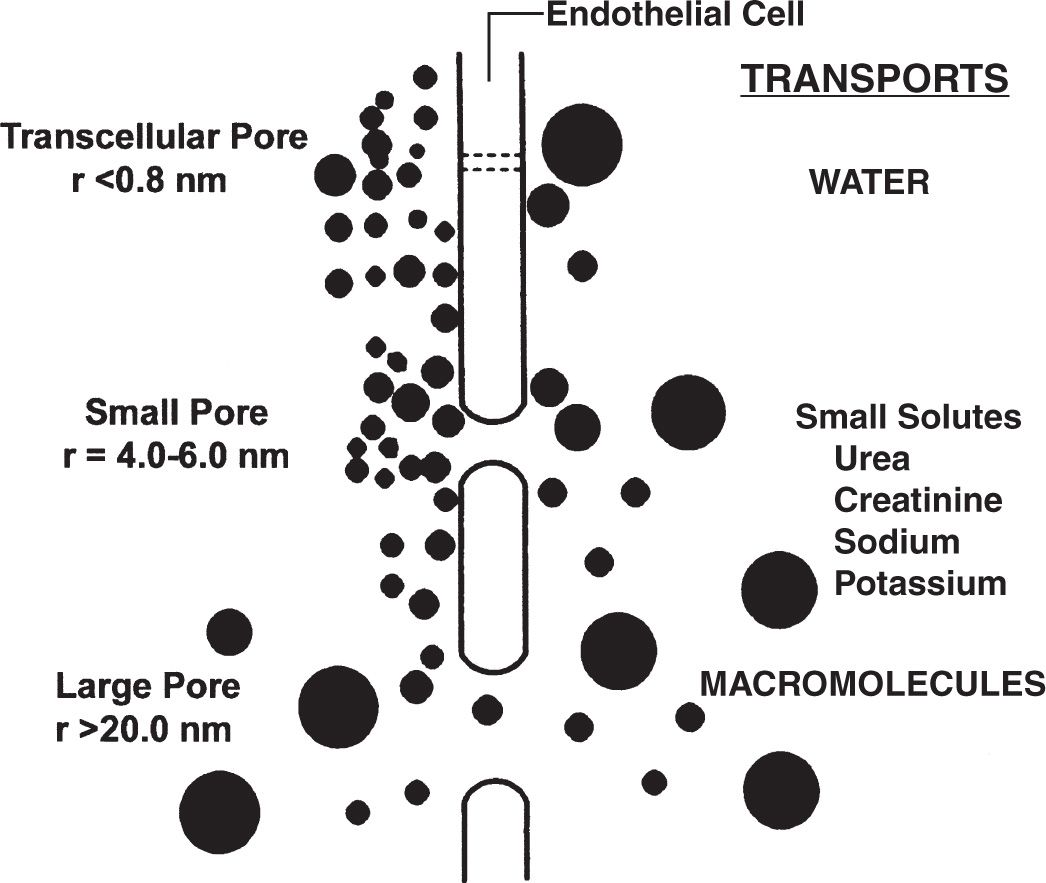
FIGURE 21.2 Diagrammatic representation of the three-pore model of peritoneal transport. (Adapted from Flessner MF. Peritoneal transport physiology: insights from basic research. J Am Soc Nephrol. 1991;2:122.)
c. Ultrapores with a radius of <0.8 nm, are thought to be aquaporins in the endothelial cell membrane. The ultrapores are responsible for the transport of water only and account for “sieving” by the peritoneal membrane (see what follows).
2. Distributed model and effective peritoneal surface area. The distributed model emphasizes the importance of the distribution of capillaries in the peritoneal membrane and of the distance water and solutes have to travel from the capillaries across the interstitium to the mesothelium (Fig. 21.3). Transport is dependent on the surface area of the peritoneal capillaries rather than on the total peritoneal surface area. Furthermore, the distance of each capillary from the mesothelium determines its relative contribution. The cumulative contribution of all of the peritoneal capillaries determines the effective surface area and the resistance properties of the membrane. From the distributed model, the concept of “effective peritoneal surface area” has arisen. This is the area of the peritoneal surface that is sufficiently close to the peritoneal capillaries to play a role in transport. Therefore, two patients with the same peritoneal surface area may have markedly different peritoneal vascularity and very different effective peritoneal surface areas. In a given patient, effective peritoneal surface area may vary in different circumstances, increasing, for example, in peritonitis when inflammation increases vascularity. The degree of vascularity of the peritoneum is more important than its surface area in determining the transport characteristics of an individual patient.
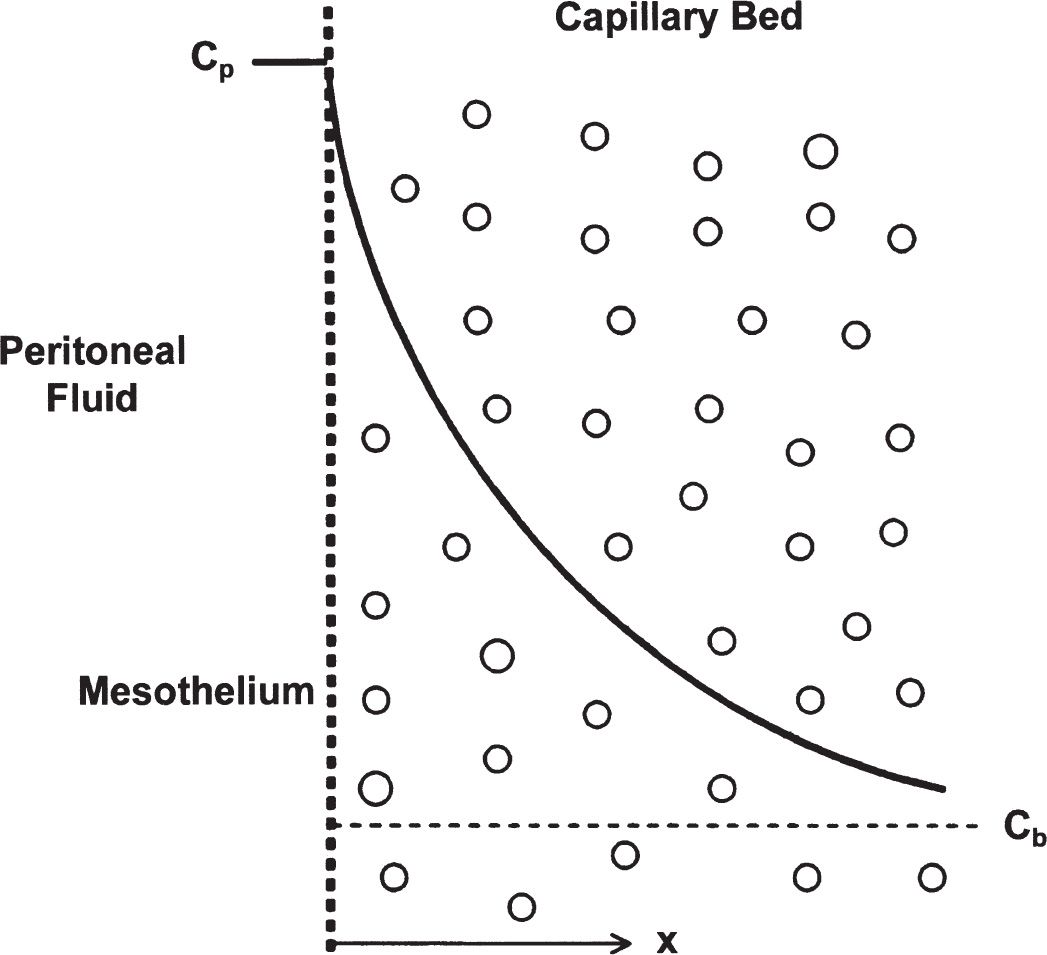
FIGURE 21.3 Distributed model concept showing distribution of peritoneal capillaries in the interstitium and their distances from the mesothelium, represented by the dotted, vertical line. Cp, the solid, curved line, represents the efficiency of transport from a given capillary to the peritoneal space, increasing for capillaries located closest to the mesothelial boundary. (Adapted from Flessner MF. Peritoneal transport physiology: insights from basic research. J Am Soc Nephrol. 1991;2:122.)
III. PHYSIOLOGY OF PERITONEAL TRANSPORT. Peritoneal transport comprises three processes that take place simultaneously: (a) diffusion, (b) ultrafiltration, and (c) fluid absorption.
A. Diffusion. Uremic solutes and potassium diffuse from peritoneal capillary blood into the peritoneal fluid, whereas glucose and lactate or bicarbonate present in the dialysate diffuse in the opposite direction. Peritoneal diffusion depends on the following factors:
1. The concentration gradient. For a substance such as urea, this is maximal at the start of a peritoneal dialysis dwell, when the concentration in the dialysis solution is zero. With ongoing diffusion during the course of the dwell, this gradient gradually decreases. The diminishing gradient can be counteracted partially by the performance of more frequent exchanges, as is typically done in APD, or by increasing dwell volumes, which allows the gradient to remain greater for a longer time.
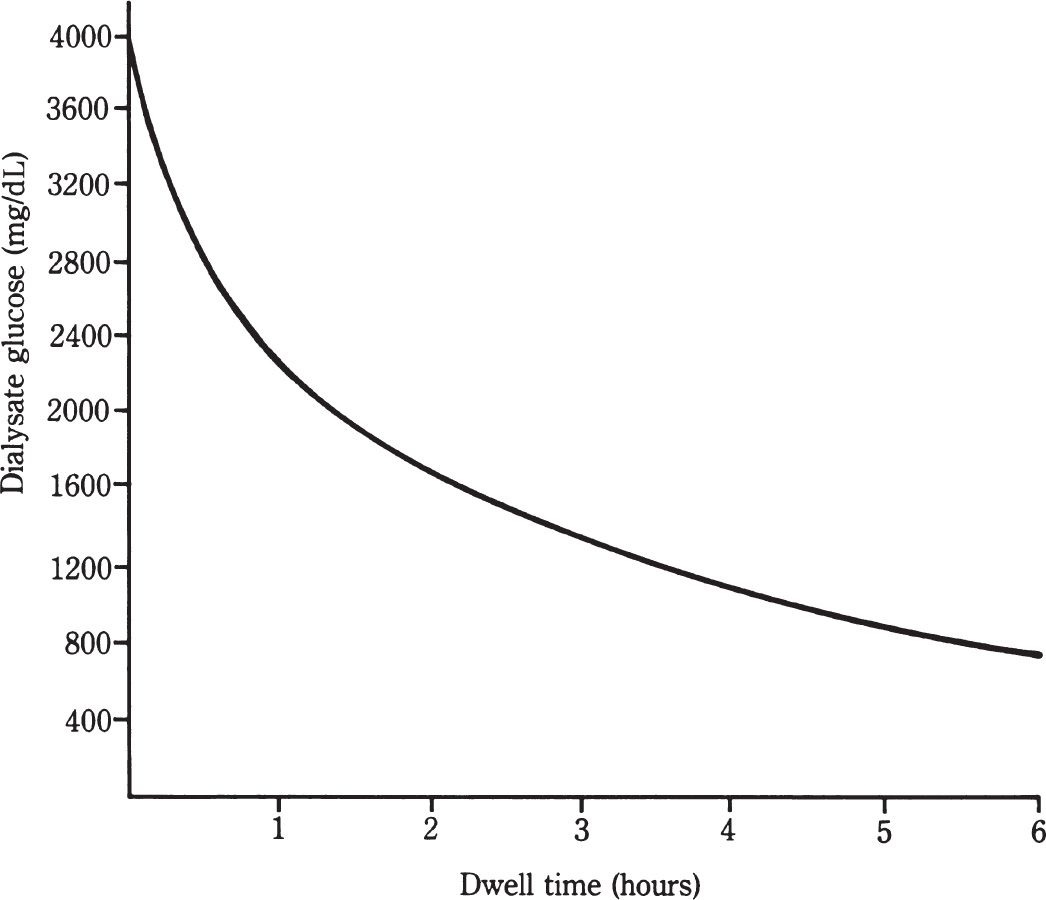
FIGURE 21.4 Dialysate glucose level after instillation of a 4.25% dextrose (3.86% glucose) exchange into the peritoneal cavity. The initial level is close to 3,860 mg/dL (214 mM).
2. Effective peritoneal surface area. This can be increased by using larger fill volumes, which recruit more peritoneal membrane, but this effect is limited in most individuals once volumes reach 2.5–3 L.
3. Intrinsic peritoneal membrane resistance. This parameter is not well characterized but may reflect differences in the number of pores per unit surface area of capillary available for peritoneal transport and the distance between these capillaries and the mesothelium.
4. Molecular weight of the solute. Substances with lower molecular weight, such as urea (MW 60), are more rapidly transported by diffusion than those with higher molecular weights, such as creatinine (MW 113) or uric acid (MW 168).
5. Mass transfer area coefficient. The combined effects of factors 2–4 are sometimes measured by an index called the mass transfer area coefficient (MTAC), which is analogous to the K0A of a hemodialysis membrane. For a given solute, the MTAC is equivalent to the diffusive clearance of that solute per unit time in a theoretical situation in which dialysate flow is infinitely high so that the solute gradient is always maximal. Typical MTAC values for urea and creatinine are 17 and 10 mL/min, respectively. The MTAC is mainly a research tool and is not used much in clinical practice.
6. Peritoneal blood flow. Diffusion generally does not depend on peritoneal blood flow, which, at 50–100 mL/min, is already more than adequate relative to MTAC values for even the smallest solutes. Instead, in contrast to the situation in hemodialysis, diffusion in peritoneal dialysis is dependent primarily on the dialysate flow rate. Vasoactive agents do influence peritoneal transport, but this is not related to their ability to increase peritoneal blood flow; rather, it is due to recruitment of larger numbers of peritoneal capillaries, increasing the effective peritoneal surface area. The same effect is seen in peritonitis, where inflammation increases peritoneal vascularity with a consequent increase in diffusion.
Related posts:


Stay updated, free articles. Join our Telegram channel

Full access? Get Clinical Tree


