Magnetic Resonance Imaging Appearance of 101 Abdominal and Pelvic Abnormalities
Guide to this Section
This section provides the reader with a quick reference to the typical magnetic resonance imaging (MRI) appearances of some commonly encountered (and a few uncommon) diseases of the abdomen and pelvis. Note that any lesion might have more than one appearance on MRI, and the information contained herein should only be used as a starting point in the development of a differential diagnosis.
The material is organized in the following manner:
T1: Typical appearance or signal intensity relative to organ of origin or surrounding structures on a T1-weighted image.
T2: Typical appearance or signal intensity relative to organ of origin or surrounding structures on a T2-weighted image.
Enhancement pattern: Typical enhancement pattern on dynamic and delayed imaging with intravenous gadolinium (unless otherwise specified).
Characteristic features: Findings that suggest the diagnosis.
Distribution: Typical location and multiplicity of abnormalities.
Atypical appearances: Atypical findings that may confuse diagnosis.
Associations: Associated abnormalities or syndromes.
Mimics: Other entities that may have a similar appearance.
Additional comments: Ancillary information.
Liver, Focal Abnormalities
Abscess, Amebic
Description: Abscess caused by the protozoan parasite Entamoeba histolytica.
T1: Low signal intensity center.
T2: High signal intensity center. High signal intensity edema may be present around abscess.
Enhancement pattern: Thick enhancing wall.
Characteristic features: Solitary rim-enhancing mass with no central enhancement on delayed contrast-enhanced images in patient with history of fever and diarrhea.
Distribution: Right lobe greater than left. Typically solitary.
Associations: Travel to endemic areas.
Mimics: Pyogenic abscess, necrotic tumor.
Additional comments: May invade and rupture through hemidiaphragm causing empyema (well demonstrated on coronal images).
Abscess, Fungal (Fig. 3.4)
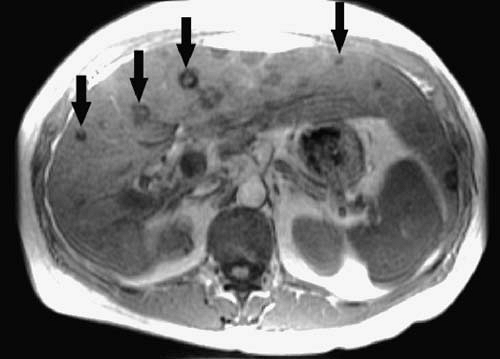 FIG. 3.4. Candida abscesses. Axial T1-weighted gradient echo image through liver demonstrates multiple low signal intensity hepatic lesions (arrows), some of which have central high signal intensity foci. |
Description: Discrete lesions resulting from fungal infection of the liver. Most common offending organism is Candida albicans. Other organisms include Aspergillus and Cryptococcus. Fungal infection of the liver almost always occurs in the setting of a compromised immune system.
T1: Hypointense to mildly hyperintense relative to liver.
T2: High signal intensity.
Enhancement pattern: Usually nonenhancing in immunocompromised patients. Once an immune response can be mounted, lesions may have a more characteristic abscess-like appearance with rim enhancement.
Characteristic features: Lesions often less than 1 cm in diameter and multiple.
Distribution: Multiple. Involves all lobes with some peripheral predilection.
Atypical appearances: In the setting of transfusional hemosiderosis, treated lesions tend to develop a low signal intensity peripheral rim. Healed lesions are low signal intensity on all sequences and do not enhance.
Associations: Involvement of the spleen and kidneys.
Mimics: Multiple pyogenic abscesses, cystic or necrotic metastases, sarcoidosis.
References: 3
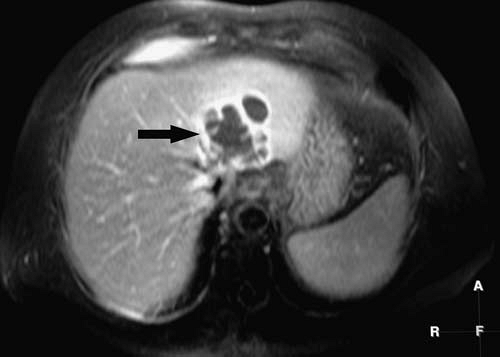 FIG. 3.5. Pyogenic abscess. Fat-suppressed, T1-weighted gradient echo image after intravenous gadolinium administration in same patient as Figure 3.2 shows complex hypointense lesion with rim-enhancement (arrow). |
Description: Bacterial infection of the liver characterized by purulent central area surrounded by granulation tissue and inflammation.
T1: Heterogeneous, low signal intensity.
T2: High signal intensity.
Enhancement pattern: Early mural enhancement (typically up to 5 mm) without change in thickness on later images. Perilesional enhancement may be present.
Characteristic features: Septations common. Presence of gas results in areas of signal void, which become more obvious on T2*-weighted images secondary to susceptibility artifact.
Distribution: Solitary or multiple.
Atypical appearances: Infected necrotic tumor may demonstrate thick, irregular wall.
Associations: Ascending cholangitis, diverticulitis, appendicitis, recent biliary procedure, trauma.
Mimics: Necrotic metastases, lymphoma, hydatid disease, necrotic hepatocellular carcinoma (HCC). Necrotic tumors tend to demonstrate thick, irregular walls that enhance in a centripetal manner.
Additional comments: When hepatic abscesses are present, always look for evidence of portal venous gas or thrombus and inflammatory disease elsewhere in the abdomen.
Adenoma (Figs. 3.6, 3.7)
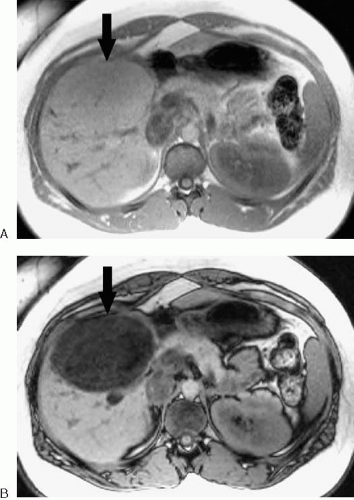 FIG. 3.6. Hepatic adenoma. In-phase (A) and opposed-phase (B) gradient echo images show large mass in right hepatic lobe (arrow) that loses signal on opposed-phase image as a result of intracytoplasmic lipid content. |
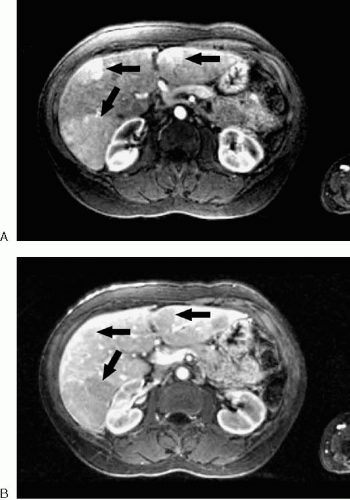 FIG. 3.7. Hepatic adenomas. A: Arterial phase, fat-suppressed, gradient echo image demonstrates multiple enhancing hepatic lesions (arrows). B: Portal venous phase image from same dynamic examination shows lesions (arrows) are slightly less intense than surrounding liver. |
Description: Benign epithelial tumor of hepatocellular origin.
T1: Variable signal intensity. Hemorrhage or fat content may cause high signal intensity foci. Areas of fibrosis, necrosis, or calcification may create low signal intensity foci.
T2: Near isointense to slightly hyperintense relative to liver.
Enhancement pattern: Early enhancement (typically less intense than focal nodular hyperplasia [FNH]).
Characteristic features: Often heterogeneous in appearance due to hemorrhage. May decrease in signal intensity on opposed-phase images as a result of lipid content. Enhances with and retains mangafodipir as a result of functioning hepatocytes.
Distribution: Frequently solitary and variable in location. Multiple (>10) in hepatic adenomatosis.
Atypical appearances: May have low signal intensity pseudocapsule on T1-weighted images. May exhibit central scar.
Associations: Oral contraceptives, anabolic steroids, glycogen storage disease Ia.
Mimics: HCC, atypical FNH, focal fat.
Additional comments: Hepatic adenomas may become complex in appearance as a result of repeated hemorrhage. Distinction from a well-differentiated HCC may be difficult or impossible. Malignant transformation of hepatic adenoma is rare and is more common in liver adenomatosis.
Angiosarcoma
Description: Rare primary malignant mesenchymal tumor of the liver characterized by spindle-shaped cells that form vascular channels.
T1: Low signal intensity with hemorrhagic foci of increased signal intensity.
T2: Heterogeneous, predominantly high signal intensity. Low signal intensity areas may represent fibrous component or hemosiderin. Fluid-fluid levels may be present.
Enhancement pattern: Heterogeneous enhancement early with progressive enhancement on more delayed images.
Characteristic features: Angiosarcoma most commonly appears as multiple nodules or a dominant mass with or without satellite lesions. Tumor is hypervascular but dominant masses enhance heterogeneously with progressive enhancement over time.
Distribution: Frequently, multiple masses are present. Metastases (lung, spleen, bone) are common at presentation.
Associations: Exposure to agents such as thorium dioxide (Thorotrast), arsenic, and vinyl chloride has been associated with angiosarcoma, but cases may occur without known risk factors.
Mimics: Atypical hemangioma, HCC (typically does not demonstrate progressive enhancement or splenic involvement), hypervascular metastases.
References: 8
Bile Duct Hamartoma (Von Meyenburg Complex) (Fig. 3.8; see Fig. 3.143)
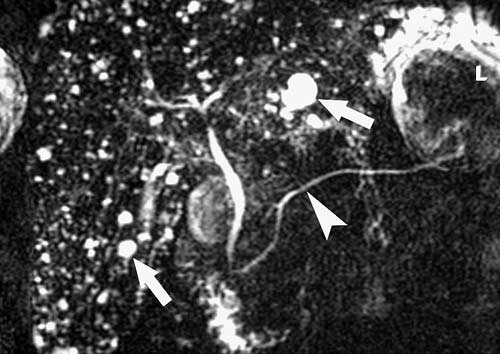 FIG. 3.8. Bile duct hamartomas. Thick-slab magnetic resonance cholangiopancreatography image demonstrates multiple small cystic lesions throughout the liver (arrows). Arrowhead denotes pancreatic duct. |
Description: Benign malformation of bile duct origin.
T1: Low signal intensity.
T2: Very high signal intensity.
Enhancement pattern: Nonenhancing. May demonstrate a thin rim of apparent contrast enhancement secondary to compressed surrounding parenchyma.
Characteristic features: Multiple, well-defined, cystic-appearing lesions, most measuring less than 1 cm, dispersed throughout the liver.
Distribution: Multiple, diffuse.
Mimics: Caroli’s disease, multiple hepatic cysts, cystic metastases.
Additional comments: Commonly confused with simple cysts on imaging.
References: 9
Biliary Cystadenoma and Cystadenocarcinoma (Fig. 3.9)
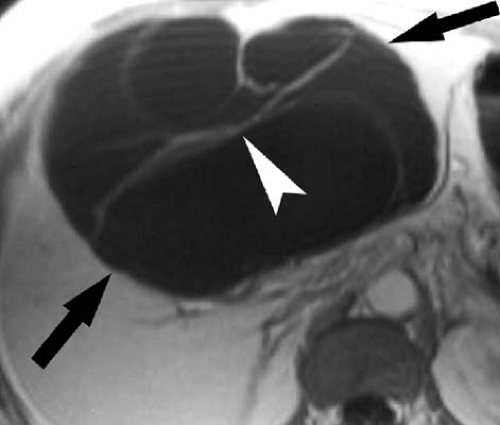 FIG. 3.9. Biliary cystadenoma. T1-weighted image following gadolinium administration demonstrates large cystic mass (arrows) in liver with thin septations (arrowhead). |
Description: Rare cystic tumor of biliary origin.
T1: Cysts usually dark but vary in signal characteristics depending on their blood and protein content.
T2: Cysts typically very bright but may vary in signal intensity.
Enhancement pattern: Cyst walls and septations enhance with intravenous gadolinium chelates. Mural nodules, when present, also enhance.
Characteristic features: Complex multilocular cystic mass with septations and variable mural nodularity. Benign and malignant lesions cannot be reliably distinguished, although mural nodularity favors malignant tumor.
Distribution: No characteristic distribution but more common in right lobe. Typically solitary.
Atypical appearances: Unilocular cystic mass.
Mimics: Complex cystic lesions of the liver such as abscess, echinococcal cysts, necrotic tumors.
Additional comments: Female predominance. Usually age older than 30 years.
References: 10
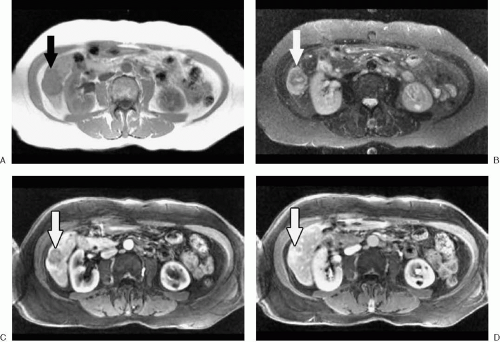 FIG. 3.10. Peripheral cholangiocarcinoma. A: T1-weighted gradient echo image shows hypointense mass (arrow) in caudal right hepatic lobe. B: Mass (arrow) is hyperintense on fat-suppressed T2-weighted image. C: During arterial phase of dynamic, gadolinium-enhanced sequence, mass (arrow) is hypoenhancing relative to liver. D: Delayed fat-suppressed T1-weighted gradient echo image obtained after several minutes demonstrates lesion (arrow) to be slightly hyperintense to liver. |
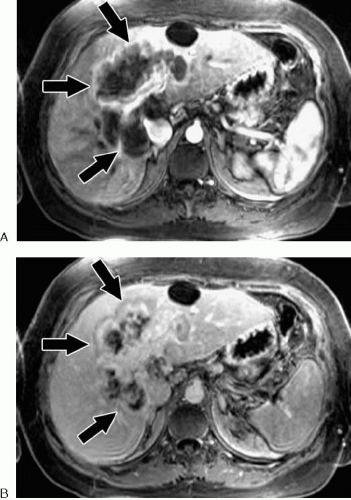 FIG. 3.11. Advanced cholangiocarcinoma. A: Early image from fat-suppressed, gadolinium-enhanced dynamic gradient echo sequence shows large hypovascular mass (arrows) involving central portion of liver. B: Delayed image obtained several minutes later shows progressive enhancement of tumor (arrows). |
Description: The majority of cholangiocarcinomas are sclerosing adenocarcinomas arising from bile duct epithelium. Other histologic types are possible, including anaplastic and squamous. After HCC, second most common primary hepatic malignant tumor.
T1: Hypointense to liver.
T2: Mildly hyperintense to liver.
Enhancement pattern: Delayed enhancement is typical. Early peripheral enhancement may occur. Complete enhancement may take several minutes.
Characteristic features: Delayed enhancement of this tumor distinguishes it from many other focal hepatic masses. Central lesions associated with biliary obstruction, occasionally resulting in parenchymal atrophy of the affected portion of the liver. Tends to extrinsically compress rather than invade portal vessels. Central necrosis, fibrosis, and hyalinization are common in large tumor masses.
Distribution: Peripheral cholangiocarcinomas arise from higher order peripheral ducts and appear as intrahepatic masses. Satellite lesions are common with peripheral cholangiocarcinomas. Tumors arising from the region of the right and left hepatic duct confluence are commonly referred to as hilar (or Klatskin) tumors. Extrahepatic tumors arise from the common hepatic or common bile ducts.
Atypical appearances: Portal vein invasion is uncommon. Calcifications may appear as foci of low signal intensity. A discrete mass may not be visible in some cases despite significant biliary ductal dilatation.
Associations: Primary sclerosing cholangitis, clonorchiasis, recurrent pyogenic cholangitis, choledochal cyst.
Mimics: Metastases (particularly colorectal, sarcomas), atypical HCC, other causes of biliary obstruction.
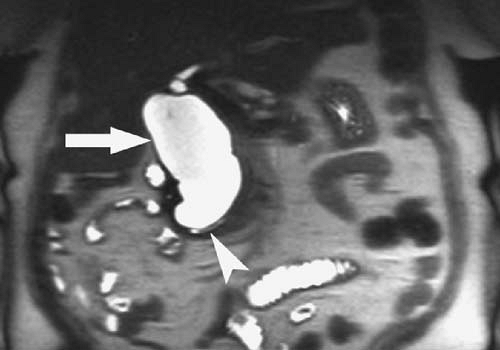 FIG. 3.12. Type I choledochal cyst. Coronal HASTE image demonstrates diffuse dilatation of the common bile duct (arrow). Arrowhead denotes distal pancreatic duct. |
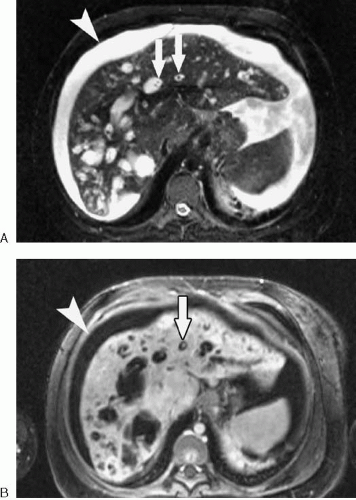 FIG. 3.13. Caroli disease. Fat-suppressed T2-weighted (A) and fat-suppressed, gadolinium-enhanced T1-weighted (B) images of the liver demonstrate multiple cystic lesions throughout liver, some of which appear tubular with “central dot sign” (arrows). Note ascites (arrowhead). |
Description: Congenital cystic dilatation of the bile ducts. An anomalous union of the pancreatic duct and common bile duct more than 1 cm proximal to the ampulla is thought to contribute to choledochal cyst formation by allowing reflux of pancreatic enzymes into the bile duct.
T1: Isointense to bile.
T2: Isointense to bile.
Enhancement pattern: Nonenhancing. Enhancement of thickened wall or soft-tissue nodules should raise concern for development of cholangiocarcinoma.
Characteristic features: Confident diagnosis of choledochal cyst and differentiation from other cystic entities relies on demonstrating direct communication between the
cyst and the biliary system. A useful diagnostic sign in Caroli disease is the “central dot sign.” The central “dot” represents the portal triad vessels surrounded by dilated bile ducts.
cyst and the biliary system. A useful diagnostic sign in Caroli disease is the “central dot sign.” The central “dot” represents the portal triad vessels surrounded by dilated bile ducts.
Distribution: Type I cysts are most common and consist of dilatation of the common bile duct. Type II cysts are diverticula-like cysts communicating with the common bile duct, often by a stalk. Type III cysts, often referred to as choledochoceles, are characterized by cystic dilatation of the intraduodenal portion of the common bile duct. Type IV cysts are multiple dilatations involving the intrahepatic and extrahepatic ducts (IVA) or extrahepatic ducts (IVB). Type V cysts are usually referred to as Caroli disease and consist of multiple cysts of the intrahepatic bile ducts.
Associations: Cholangiocarcinoma.
Mimics: Other cystic lesions of the liver or periampullary region.
Confluent Hepatic Fibrosis (Fig. 3.14)
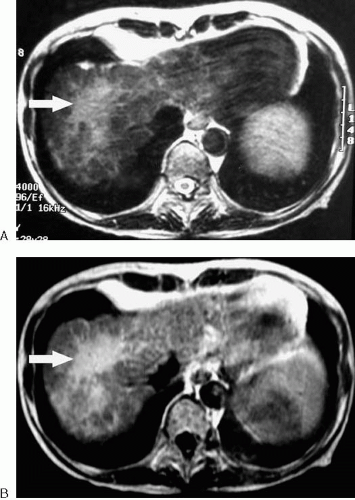 FIG. 3.14. Confluent hepatic fibrosis. A: T2-weighted image through liver of cirrhotic patient shows irregular area of high signal intensity (arrow) near hepatic dome. B: Same area (arrow) demonstrates homogeneous enhancement on delayed post-gadolinium T1-weighted image. |
Description: Mass-like region of hepatic fibrosis occurring in the setting of cirrhosis.
T1: Hypointense to liver
T2: Hyperintense to liver
Enhancement pattern: Usually progressive enhancement after intravenous gadolinium administration. Arterial phase enhancement may occur.
Characteristic features: Associated with parenchymal atrophy and capsular retraction. Progressive enhancement after contrast administration is typical.
Distribution: Linear or wedge-shaped areas extend from porta hepatis to liver capsule. Commonly involves medial segment of the left lobe and anterior segment of the right lobe.
Associations: Cirrhosis.
Mimics: Cholangiocarcinoma, HCC.
Additional comments: Typical shape, location, and
signal intensity or enhancement pattern usually allows a correct diagnosis, but atypical cases may require biopsy or close follow-up to exclude HCC.
signal intensity or enhancement pattern usually allows a correct diagnosis, but atypical cases may require biopsy or close follow-up to exclude HCC.
Cyst, Simple Benign (Fig. 3.15)
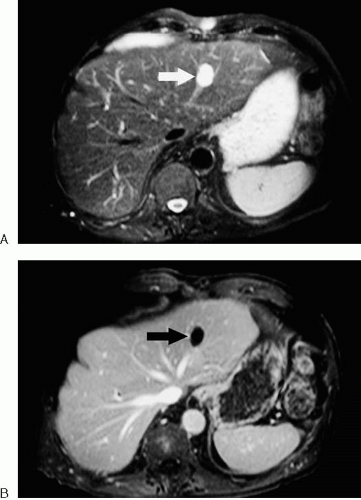 FIG. 3.15. Hepatic cyst. A: Fat-suppressed T2-weighted image shows cyst (arrow) to be of uniform high signal intensity. B: Fat-suppressed, gadolinium-enhanced T1-weighted gradient echo image shows no enhancement of cyst (arrow). |
Description: Epithelial lined, round or oval shaped, fluid-filled lesion.
T1: Hypointense.
T2: Very hyperintense.
Enhancement pattern: No enhancement.
Characteristic features: Sharply marginated and typically unilocular. Very long T2 relaxation time.
Distribution: Frequently multiple. No particular distribution.
Atypical appearances: Septations may be present. Hemorrhage or proteinaceous material may cause increased signal
intensity on T1-weighted images and decreased signal intensity on T2-weighted images.
intensity on T1-weighted images and decreased signal intensity on T2-weighted images.
Associations: Autosomal dominant polycystic kidney disease.
Mimics: Cystic metastases, Caroli disease, bile duct hamartomas, echinococcal disease, abscess.
Dysplastic Nodule (Fig. 3.16)
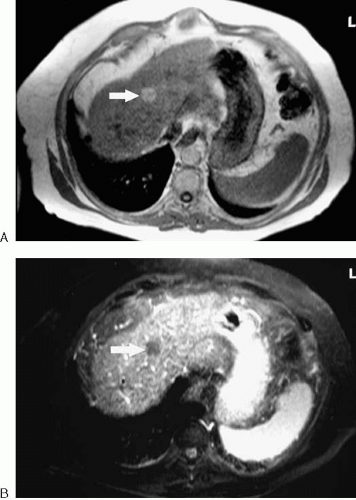 FIG. 3.16. Dysplastic nodule. A: T1-weighted gradient echo image of liver in patient with cirrhosis shows high signal intensity hepatic nodule (arrow). B: Fat-suppressed T2-weighted image shows nodule (arrow) to be low in signal intensity. Biopsy revealed atypical cells but no malignancy. |
Description: Dysplastic nodules represent an intermediate step in the continuum from regenerative nodule to HCC in the setting of cirrhosis. They contain abnormal hepatocytes with variable amounts of cytologic atypia but no clear malignancy. Dysplastic nodules are considered premalignant lesions.
T1: Increased signal intensity on T1-weighted images is considered typical. Siderotic dysplastic nodules demonstrate decreased signal intensity.
T2: Hypointense to isointense. On T2*-weighted gradient echo images, iron-containing nodules appear dark. Foci of increased signal intensity should raise concern for HCC.
Enhancement pattern: Variable, but typically enhance less than or equal to liver, because most dysplastic nodules have predominately portal venous blood supply.
Characteristic features: The classically described dysplastic nodule has high signal intensity on T1-weighted and low signal intensity on T2-weighted images without significant arterial phase enhancement.
Distribution: Diffuse and multiple.
Atypical appearances: Some dysplastic nodules may enhance during the arterial phase, making distinction from HCC difficult or impossible.
Associations: Cirrhosis, chronic hepatitis.
Mimics: Well-differentiated HCC, benign regenerative nodules associated with Budd-Chiari syndrome.
Additional comments: Some overlap exists between the imaging appearance of dysplastic nodules and that of well-differentiated HCC. Features that should increase suspicion
for carcinoma include increased signal intensity on T2-weighted images, arterial phase enhancement, large size, presence of a pseudocapsule, or rapid growth. In addition, a focal region of arterial enhancement or high signal intensity on T2-weighted images in an otherwise typical dysplastic nodule is suspicious for development of a focus of HCC (nodule-within-a-nodule sign). Siderotic regenerative nodules and siderotic dysplastic nodules may be indistinguishable with MRI. High signal intensity nodules are relatively common on T1-weighted images of cirrhotic livers. Not all nodules with increased signal intensity on T1-weighted images are dysplastic.
for carcinoma include increased signal intensity on T2-weighted images, arterial phase enhancement, large size, presence of a pseudocapsule, or rapid growth. In addition, a focal region of arterial enhancement or high signal intensity on T2-weighted images in an otherwise typical dysplastic nodule is suspicious for development of a focus of HCC (nodule-within-a-nodule sign). Siderotic regenerative nodules and siderotic dysplastic nodules may be indistinguishable with MRI. High signal intensity nodules are relatively common on T1-weighted images of cirrhotic livers. Not all nodules with increased signal intensity on T1-weighted images are dysplastic.
Embryonal Sarcoma (Fig. 3.17)
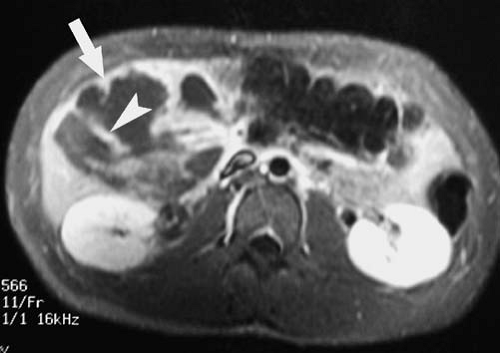 FIG. 3.17. Embryonal sarcoma in teenager. Post-gadolinium, fat-suppressed T1-weighted image shows peripheral enhancement of tumor (arrow) with thick internal enhancing tissue septa (arrowhead). Lesion was very bright on T2-weighted image (not shown). |
Description: Uncommon primary hepatic malignant tumor composed of spindle- and stellate-shaped cells in a myxoid background.
T1: Predominantly low signal intensity. Focal areas of high signal intensity represent hemorrhage.
T2: Very high signal intensity approaching that of cerebrospinal fluid.
Enhancement pattern: Enhancement of solid tissue components, mainly involving the tumor periphery and some septum-like areas within the tumor, creating a heterogeneous appearance after gadolinium administration.
Characteristic features: These tumors often appear cystlike on MR images but appear solid on sonograms. Areas of cystic hemorrhagic degeneration are relatively common (best appreciated on T1-weighted images).
Distribution: Solitary. More commonly described in right hepatic lobe.
Atypical appearances: An intratumoral fluid-debris level may occasionally be seen.
Mimics: Other complex cystic tumors of the liver, including cystic metastases, hepatic abscess, and resolving hematoma.
Additional comments: Occurs mainly in children and young adults.
References: 20
Fatty Infiltration, Focal (Fig. 3.18)
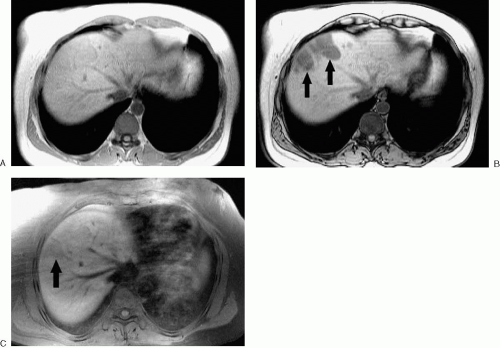 FIG. 3.18. Focal fat. A: In-phase T1-weighted gradient echo image shows homogeneous liver. B: Opposed-phase gradient echo image shows areas of focal signal loss (arrows) consistent with focal steatosis. C: T1-weighted gradient echo image with fat saturation in same patient is not nearly as effective at demonstrating areas of steatosis (arrow). |
Description: The focal form of hepatic steatosis.
T1: Isointense to slightly hyperintense relative to normal liver.
T2: Isointense to slightly hyperintense on non-fat-saturated images.
Enhancement pattern: Similar to normal liver
Characteristic features: Loss of hepatic signal intensity on opposed-phase gradient echo images. Lacks mass effect on vessels or bile ducts.
Distribution: May be focal, multifocal, or diffuse. Location highly variable, but typical locations include adjacent to falciform ligament, central aspect of medial segment, and adjacent to gallbladder fossa.
Atypical appearances: May appear as multiple discrete nodules
Mimics: Lipid-containing adenoma or HCC.
References: 21
Fibrolamellar Hepatocellular Carcinoma
Description: Desmoplastic malignant tumor of hepatocellular origin. Fibrous septa and central stellate scar are characteristic.
T1: Slightly hypointense, heterogeneous. Low signal intensity central scar.
T2: Variably hyperintense. Low signal intensity central scar.
Enhancement pattern: Enhances early, intensely, and heterogeneously. Central scar poorly enhancing, but may enhance after a delay of several minutes.
Characteristic features: Lobulated mass in noncirrhotic liver of a young adult. Tumor tends to be large at time of diagnosis. A nonenhancing central scar that is hypointense on both T1- and T2-weighted images helps distinguish this entity from FNH. Central scar may be calcified on computed tomography (CT).
Distribution: Typically solitary.
Atypical appearances: May occur in middle-aged and older patients. Central scar may be absent.
Associations: Unlike typical HCC, fibrolamellar HCC is not associated with cirrhosis.
Mimics: FNH.
Additional comments: Alpha-fetoprotein is usually within normal range.
References: 22
Focal Nodular Hyperplasia (Fig. 3.19; see 3.146)
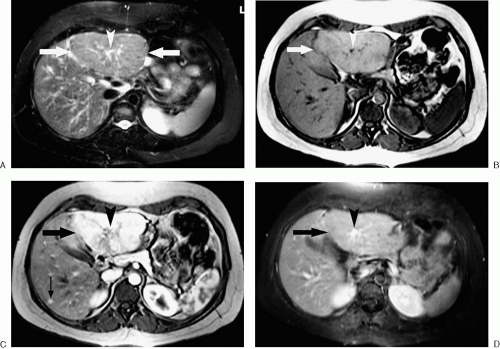 FIG. 3.19. Focal nodular hyperplasia. A: Fat-suppressed T2-weighted image through liver shows large mass (arrows) in left hepatic lobe that is nearly isointense to liver. High signal intensity central scar is present (arrowhead). B: Mass (arrow) is slightly higher in signal intensity than liver on T1-weighted opposed-phase gradient echo image due to mild hepatic steatosis. Central scar (arrowhead) is low signal intensity. C: During arterial phase of dynamic gadolinium-enhanced study, mass (arrow) is hyperenhancing, although central scar (arrowhead) remains dark. Note incidental second lesion (thin arrow). D: Delayed gadolinium-enhanced, fat-suppressed T1-weighted image shows the mass (arrow) as isointense to liver, although central scar (arrowhead) is enhancing. |
Description: Focal masslike area of hyperplasia composed of hepatocytes, Kupffer cells, and bile ducts. Central scar consists of vascular channels, fibrosis, and bile ducts.
Once described as rare in the literature, these lesions are commonly discovered on dynamic, contrast-enhanced images.
Once described as rare in the literature, these lesions are commonly discovered on dynamic, contrast-enhanced images.
T1: Nearly isointense to liver with low signal intensity central scar (when present).
T2: Nearly isointense to minimally hyperintense with high signal intensity central scar (when present).
Enhancement pattern: Early intense enhancement. Fades rapidly to become nearly isointense to liver on later images. Delayed enhancement of central scar. Mass enhances with and retains mangafodipir due to presence of functioning hepatocytes. Uptake of ferumoxides is typical due to presence of Kupffer cells. Signal loss of FNH following ferumoxides administration typically exceeds that of other tumors.
Characteristic features: Well marginated lobulated mass, often nearly invisible on precontrast T1- and T2-weighted images. Typical appearance of stellate central scar very specific for diagnosis. May be associated with abnormal vasculature.
Distribution: Subcapsular location is common. Two or more lesions are present in up to one third of patients with FNH.
Atypical appearances: May be pedunculated. Central scar or early enhancement may be absent. May rarely contain sufficient lipid to lose signal on opposed-phase imaging (see Fig. 3.125). May appear hyperintense on T1-weighted images or moderately bright on T2-weighted images.
Associations: Hepatic hemangioma.
Mimics: Fibrolamellar carcinoma, hepatic adenoma (although FNH shows more exuberant arterial phase enhancement and rarely demonstrates significant intratumoral hemorrhage or steatosis).
Additional comments: No malignant potential. When typical MR findings are present, no further action is indicated.
Ferumoxides may have some utility in confirming diagnosis when typical features are absent.
Ferumoxides may have some utility in confirming diagnosis when typical features are absent.
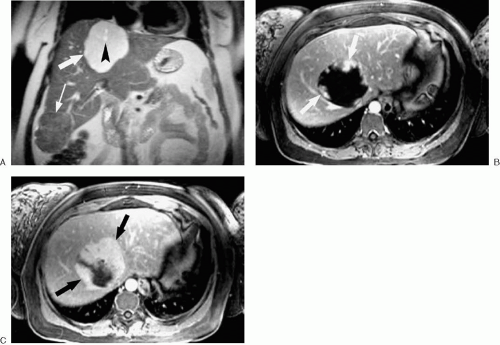 FIG. 3.20. Hemangioma. A: Coronal HASTE image shows large high signal intensity hepatic mass (arrow). Note small focus of central higher signal intensity (arrowhead). A mass of focal nodular hyperplasia (thin arrow) nearly escapes detection on this image. B: Portal venous phase image from dynamic fat-suppressed, gadolinium-enhanced sequence shows typical nodular peripheral enhancement (arrows). C: Note progressive centripetal filling (arrows) on delayed contrast-enhanced image. |
Description: Common benign vascular tumor. Most hemangiomas are cavernous lesions characterized by large vascular channels. Occasionally, lesions resemble capillary telangiectasias.
T1: Low signal intensity.
T2: Very high signal intensity.
Enhancement pattern: Most typical enhancement pattern is early peripheral nodular enhancement (puddling) with progressive centripetal enhancement of remainder of lesion (type 2 enhancement). Delayed images reveal homogeneous enhancement with retention of contrast (isointense to vessels). Small lesions may demonstrate early intense homogeneous enhancement (type 1 enhancement). Early, transient peritumoral enhancement may also occur (more common with type 1 enhancing lesions).
Characteristic features: Distinct lobular margins, typical centripetal enhancement pattern, and long T2 relaxation time are virtually diagnostic of hemangioma.
Distribution: May occur anywhere in the liver, although most common in right lobe. Frequently multiple.
Atypical appearances: May be pedunculated. May have central scar that fails to enhance with gadolinium (type 3 enhancement). Large lesions (giant hemangioma) may contain fibrous septa or areas of hemorrhage or necrosis. Sclerosing hemangiomas may have only modestly increased signal intensity on T2-weighted images. Arterial-portal shunting may be present on contrast-enhanced images.
Associations: Blue rubber bleb nevus syndrome (see Fig. 3.49), FNH, thrombocytopenia (Kasabach-Merritt syndrome).
Mimics: Angiosarcoma. Hypervascular or necrotic (postchemotherapy) metastases.
Hematoma (Fig. 3.21)
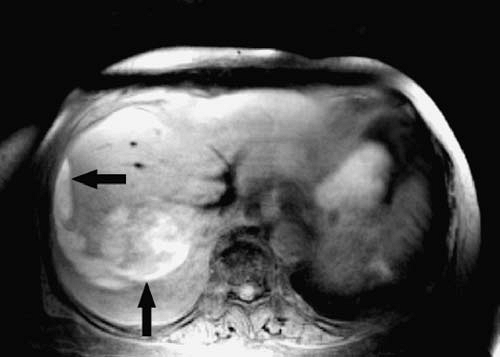 FIG. 3.21. Hepatic hematoma in patient with lymphoma. Fat-suppressed gradient echo T1-weighted image shows high signal intensity mass in right hepatic lobe with hemorrhage extending to liver capsule (arrows). |
Description: Focal hemorrhage that may occur in intraparenchymal or subcapsular locations.
T1: Mixed signal intensity. Extracellular methemoglobin results in characteristic areas of high signal intensity over the course of several days.
T2: Mixed signal intensity. Soon after hematoma forms, signal intensity is high and subsequently fades and becomes more complex as blood products evolve.
Enhancement pattern: Nonenhancing unless active bleeding is present.
Characteristic features: High signal intensity foci on T1- and T2-weighted images. Size and signal intensity vary over time.
Distribution: Intraparenchymal or subcapsular. May demonstrate fluid-fluid level.
Associations: Trauma, HELLP syndrome (hemolysis, elevated liver enzymes, and low platelet count in women with pregnancy-induced hypertension), hepatic tumors (particularly adenoma).
Mimics: Hemorrhagic cystic tumor. Lesions containing macroscopic fat are rare in the liver but may be distinguished from hemorrhage with use of fat suppression.
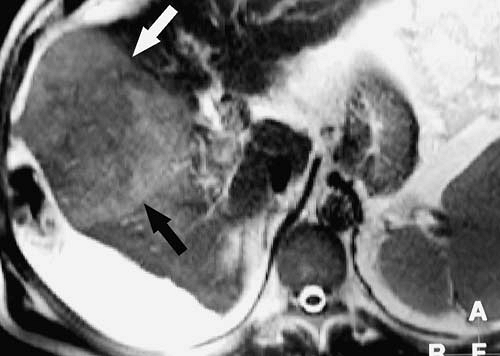 FIG. 3.22. Hepatocellular carcinoma. Axial HASTE image shows high signal intensity mass (arrows) in right lobe of cirrhotic liver. |
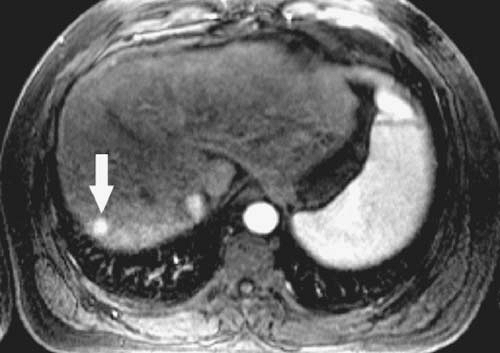 FIG. 3.23. Hepatocellular carcinoma. Axial fat-suppressed, gadolinium-enhanced arterial phase image demonstrates small hypervascular hepatocellular carcinoma (arrow). Lesion was inconspicuous on other sequences (not shown). |
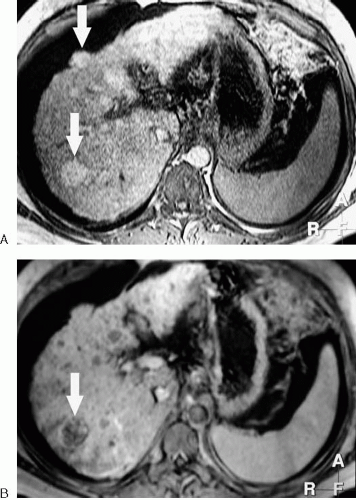 FIG. 3.24. Multifocal hepatocellular carcinoma. A: T1-weighted gradient echo image demonstrates multiple high signal intensity hepatic nodules (arrows). B: Portal venous phase post-gadolinium T1-weighted gradient echo image demonstrates heterogeneous enhancement of largest nodule (arrow). Multifocal hepatocellular carcinoma was found at transplantation. |
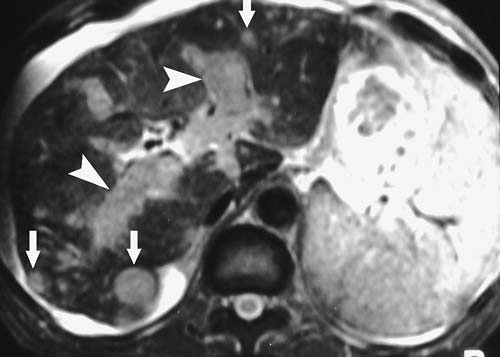 FIG. 3.25. Multifocal hepatocellular carcinoma with portal vein invasion. Fat-suppressed T2-weighted image shows multiple hepatic nodules (arrows) and expansion of the portal veins (arrowheads) with high signal intensity tumor. |
Description: Malignant tumor of hepatocellular origin. Most common primary malignant tumor of the liver.
T1: Variable, but commonly hypointense to isointense to liver. Well-differentiated HCC may be hyperintense to liver.
T2: Variable, but most commonly isointense to hyperintense to liver. Low signal intensity pseudocapsule may be present. Higher signal intensity tumors tend to be less well differentiated.
Enhancement pattern: Early, often intense, heterogeneous enhancement that fades quickly. Small lesions are frequently only visible on arterial phase images of dynamic gadolinium-enhanced study. Pseudocapsule enhancement may be present on delayed images. Well-differentiated tumors may take up and retain mangafodipir or ferumoxides as a result of residual hepatocyte or Kupffer cell function, respectively.
Characteristic features: HCC most frequently occurs in patients with underlying cirrhosis, hemochromatosis, or chronic
viral hepatitis. Portal or hepatic vein invasion presents as tumor thrombus with similar enhancement characteristics to primary tumor. Nodule-within-a-nodule appearance may be seen on T1-weighted images when low signal intensity HCC develops in a high signal intensity dysplastic nodule. Nodule-within-a-nodule appearance can also occur when a high signal intensity focus of HCC develops in a low signal intensity dysplastic nodule on T2-weighted images or a focus of enhancement is seen in a cirrhotic nodule after gadolinium administration.
viral hepatitis. Portal or hepatic vein invasion presents as tumor thrombus with similar enhancement characteristics to primary tumor. Nodule-within-a-nodule appearance may be seen on T1-weighted images when low signal intensity HCC develops in a high signal intensity dysplastic nodule. Nodule-within-a-nodule appearance can also occur when a high signal intensity focus of HCC develops in a low signal intensity dysplastic nodule on T2-weighted images or a focus of enhancement is seen in a cirrhotic nodule after gadolinium administration.
Distribution: Anywhere in the liver. May be solitary (approximately half of cases), multiple, or diffuse. Satellite lesions are common. Most common sites of extrahepatic metastases are lymph nodes, lungs, and bone.
Atypical appearances: May contain fat or invade bile ducts. Well-differentiated tumors may appear relatively hypovascular.
Associations: Cirrhosis, chronic viral hepatitis, hemachromatosis, Wilson disease, alpha1-antitrypsin deficiency, glycogen storage disease.
Mimics: Adenoma, angiosarcoma, arterial-portal shunting, confluent fibrosis, dysplastic nodule, inflammatory pseudotumor.
Additional comments: Leading cause of cancer death in Southeastern Asia and sub-Saharan Africa where chronic hepatitis is endemic. Alpha-fetoprotein levels may be normal in more than one third of patients with HCC.
Lymphoma, Hepatic
Description: Malignant lymphocytic tumor. Lymphoma of the liver most commonly results from secondary infiltration. Primary hepatic lymphoma is rare.
T1: Hypointense to isointense to liver.
T2: Typically isointense to slightly hyperintense to liver, although it can have low signal intensity.
Enhancement pattern: When present, enhancement is typically peripheral.
Characteristic features: A history of lymphoma is helpful, because the diagnosis is difficult based on imaging characteristics alone.
Distribution: Can appear as a focal mass or diffuse infiltrative process. Diffuse disease (hepatomegaly) is more common. Focal disease may be solitary or multiple and is more common with non-Hodgkin lymphoma. Periportal tumor may appear as high signal intensity on fat-suppressed T2-weighted and contrast-enhanced T1-weighted images.
Atypical appearances: Large solitary mass.
Associations: In transplant recipients on immunosuppressive therapy, posttransplant lymphoproliferative disorder affecting the liver may develop.
Mimics: Hepatic metastases.
Additional comments: Most cases of hepatic lymphoma are of the secondary, infiltrative variety. Therefore, detection may be difficult with MRI. Primary lymphoma of the liver is extremely rare.
References: 30
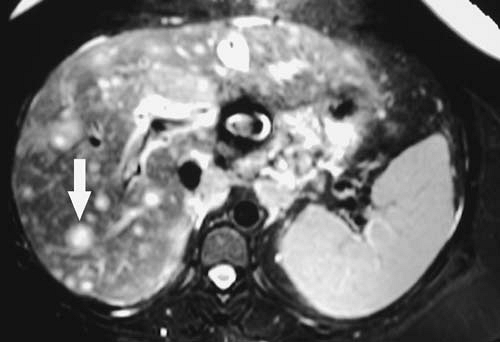 FIG. 3.26. Liver metastases, adenocarcinoma of unknown primary. Fat-suppressed T2-weighted image through liver shows multiple high signal intensity masses (arrow). |
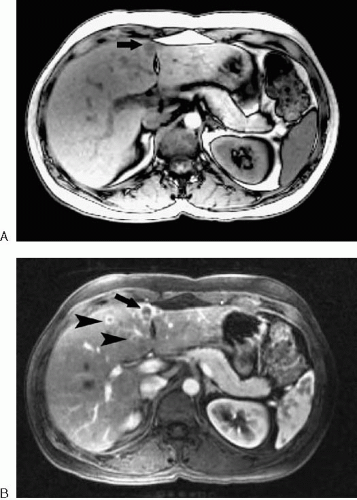 FIG. 3.27. Liver metastases, breast carcinoma. A: Opposed-phase T1-weighted gradient echo image of liver shows low signal intensity focus (arrow) adjacent to falciform ligament. On this image alone, this could be confused with focal fat. B: Following administration of intravenous gadolinium, ring enhancement is demonstrated (arrow). Two additional lesions also demonstrating ring enhancement (arrowheads) are better appreciated on enhanced study. |
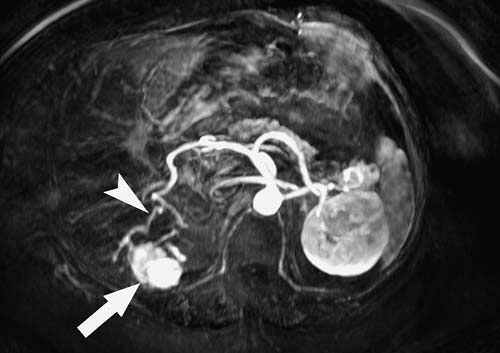 FIG. 3.28. Liver metastasis, renal cell carcinoma. Maximum intensity projection of arterial phase image from digital subtraction three-dimensional gadolinium-enhanced dynamic examination of the liver. Note briskly enhancing lesion (arrow) in right hepatic lobe supplied by large branches of the hepatic artery (arrowhead). |
Description: Malignant tumor within the liver of extrahepatic origin. Metastases are more common than primary hepatic malignant tumors. A great variety of primary malignant tumors can metastasize to the liver. However, the most common sites of origin are the gastrointestinal tract, breast, and lung.
T1: Hypointense to isointense. Uncommonly, metastases can be hyperintense relative to liver as a result of hemorrhage, melanin, or protein content.
T2: Isointense to hyperintense. Cystic (typical of ovarian cancer), mucinous, hypervascular, or necrotic metastases may be very hyperintense.
Enhancement pattern: Variable. A pattern of early ring enhancement with progressive central filling is relatively common. Delayed images may reveal peripheral washout of contrast. Perilesional enhancement may occur. Small hypervascular metastases may enhance early, intensely, and homogeneously, fading relative to hepatic parenchyma on more delayed images. Hypervascular metastases classically occur with renal cell carcinoma, melanoma, and endocrine or neuroendocrine tumors such as islet cell tumor and carcinoid. Hypervascular metastases occur less commonly with carcinoma of the breast, pancreas, colon, and lung. Most adenocarcinoma metastases are hypovascular relative to liver. With rare exceptions, metastases do not accumulate mangafodipir or ferumoxides.
Characteristic features: Metastases have a wide range of appearances. The presence of multiple hepatic lesions with irregular or ill-defined borders demonstrating uninterrupted ring enhancement with progressive central filling and delayed peripheral washout is virtually pathognomonic for metastases.
Distribution: Anywhere. Most often multiple. Solitary metastases most common with colorectal carcinoma.
Atypical appearances: The range of appearances for liver metastases is so varied that it is difficult to define an atypical case. Treated diffuse breast cancer metastases may simulate the appearance of macronodular cirrhosis.
Associations: Primary malignant tumor.
Mimics: Atypical hemangioma, adenoma, FNH (particularly when multiple), multifocal HCC, multiple hepatic abscesses.
Additional comments: Mangafodipir or ferumoxides-enhanced imaging has been advocated to improve detection of hepatic metastases. However, the majority of liver MRI examinations for evaluation of known or suspected metastatic disease are performed with gadolinium chelates.
References: 31
Regenerative Nodule
Description: Regenerative nodules are benign nodular collections of histologically normal hepatocytes between areas of fibrosis within a cirrhotic liver. Regenerative nodules should be distinguished from dysplastic nodules, which are considered premalignant.
T1: Variable but most often hypointense to isointense. Regenerative nodules often have high iron content, resulting in very low signal intensity on gradient echo images.
T2: Hypointense to isointense. On T2*-weighted gradient echo images, iron-containing nodules appear very dark.
Enhancement pattern: A cirrhotic liver is essentially composed of regenerative nodules separated by bands of fibrosis. Therefore, most regenerative nodules enhance similarly. Focal lesions that enhance significantly more than other surrounding nodules should be viewed with suspicion.
Characteristic features: Multiple small nodules of low signal intensity on both T1- and T2-weighted images are typical of regenerative nodules. Siderotic nodules are more pronounced on T2*-weighted (long echo time [TE] gradient echo) images because of the magnetic susceptibility effects of iron.
Distribution: Diffuse and multiple.
Atypical appearances: Regenerative nodules may contain lipid (Fig. 3.29). In the setting of Budd-Chiari syndrome, regenerative nodules may have increased signal intensity on T1 or T2-weighted images and enhance considerably with contrast. Infarcted regenerative nodules may demonstrate increased signal intensity on T2-weighted images.
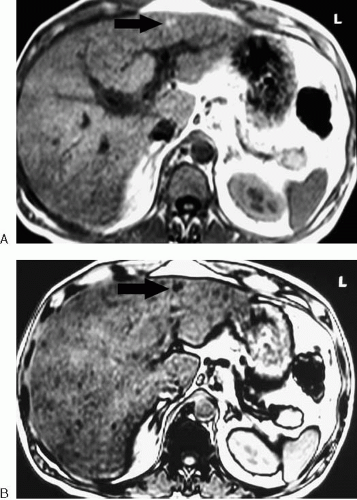 FIG. 3.29. Regenerative nodules. A: In-phase T1-weighted gradient echo image demonstrates multiple tiny nodules throughout the liver in patient with cirrhosis. Many nodules are increased in signal intensity (arrow). B: Opposed-phase image shows many of the nodules lose signal intensity (arrow), consistent with lipid content. Siderotic nodules would have demonstrated loss of signal intensity on in-phase image due to susceptibility effects. |
Associations: Cirrhosis, Budd-Chiari syndrome.
Additional comments: Available data do not strongly support a direct causative relationship between siderotic nodules and dysplasia or HCC.
Liver, Diffuse Abnormalities
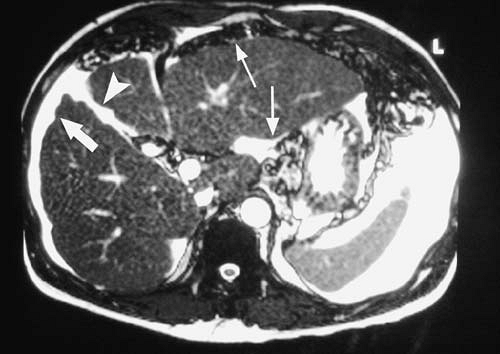 FIG. 3.30. Morphologic changes of cirrhosis. Axial steady-state gradient echo image (balanced-FFE) demonstrates nodular liver contour (arrow), widening of the interlobar fissure (arrowhead), and hypertrophy of the lateral segment (thin arrows). |
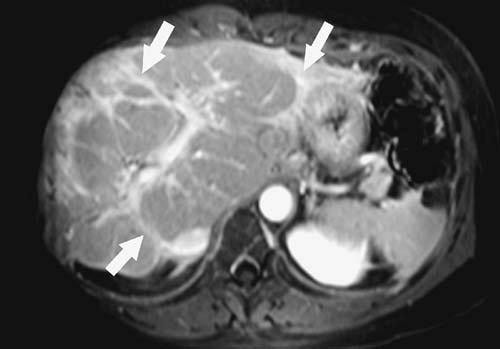 FIG. 3.31. Cirrhosis secondary to sclerosing cholangitis. Axial fat-suppressed, gadolinium-enhanced gradient echo image demonstrates findings typical of sclerosing cholangitis with large regenerative nodules surrounded by bands of fibrosis (arrows) resulting in a lobulated appearance of the liver. |
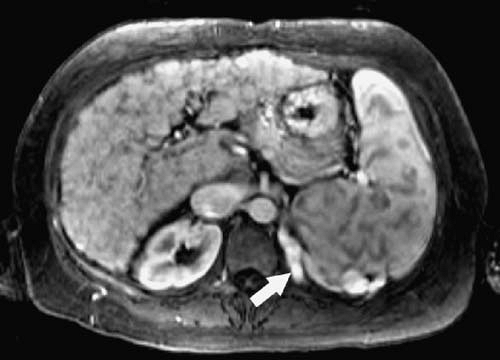 FIG. 3.32. Cirrhosis with regenerative nodules. Axial fat-suppressed, gadolinium-enhanced gradient echo image shows multiple small regenerative nodules throughout the liver associated with splenomegaly and varices (arrow). |
Description: Hepatic parenchymal cell injury associated with nodular regeneration, fibrosis, and architectural distortion.
T1: Regenerative nodules of variable signal intensity. Low signal intensity intervening fibrosis.
T2: Regenerative nodules are usually hypointense relative to surrounding fibrosis.
Enhancement pattern: Frequently heterogeneous during the arterial phase of enhancement with increasing homogeneity on subsequent postcontrast images. Confluent hepatic fibrosis often shows progressive or delayed enhancement.
Characteristic features: Nodular liver contour that may vary from micronodular to macronodular depending on the size of the regenerative nodules. Varying degrees and locations of parenchymal atrophy and hypertrophy may result in a lobulated contour that is relatively common with primary sclerosing cholangitis but uncommon with primary biliary cirrhosis. Fibrosis forms a reticular pattern of decreased (T1-weighted images) or increased (T2-weighted images) signal intensity between regenerative nodules. Siderotic regenerative nodules become more apparent on T2*-weighted images.
Distribution: A pattern of right lobe and medial segment atrophy with caudate and lateral segment preservation or hypertrophy is relatively common with cirrhosis. Expansion of the hilar periportal space and interlobar fissure is also common. Approximately one third of end-stage cirrhotic livers demonstrate diffuse atrophy. Diffuse hypertrophy of the liver and hypertrophy of the right posterior segment are rare.
Atypical appearances: Diffuse hepatic steatosis results in parenchymal signal loss on opposed-phase gradient echo images relative to in-phase images. This is in contrast to hepatic siderosis, which causes relative signal loss on the in-phase images (due to the longer TE). Small peribiliary cysts exhibiting decreased signal intensity on T1-weighted images and increased signal intensity on T2-weighted images may be present in some cases.
Associations: Ethanol abuse, viral hepatitis, primary biliary cirrhosis, primary sclerosing cholangitis, hepatic vein occlusion, Wilson disease, hemochromatosis, autoimmune disease.
Mimics: Treated breast carcinoma.
Additional comments: The process of fibrosis alters the imaging appearance of hemangiomas, preventing definitive diagnosis in some cases. Small arterially enhancing nodules are common in the cirrhotic liver with high-resolution, dynamic, gadolinium-enhanced MRI (Fig. 3.33). Most lesions less than 1 cm in diameter are benign but often cannot be reliably distinguished from HCC. Therefore, close imaging follow-up of small, arterially enhancing lesions is
appropriate, and any evidence of growth should be considered a sign of malignancy.
appropriate, and any evidence of growth should be considered a sign of malignancy.
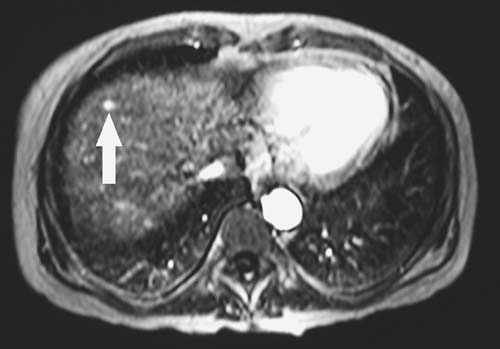 FIG. 3.33. Small hypervascular lesion in cirrhotic liver. Arterial phase image from dynamic three-dimensional gadolinium-enhanced study of patient with cirrhosis shows small enhancing lesion in dome of liver. Lesions such as this are common in cirrhosis and should be followed closely. |
Fatty Infiltration, Diffuse (Steatosis) (Fig. 3.34)
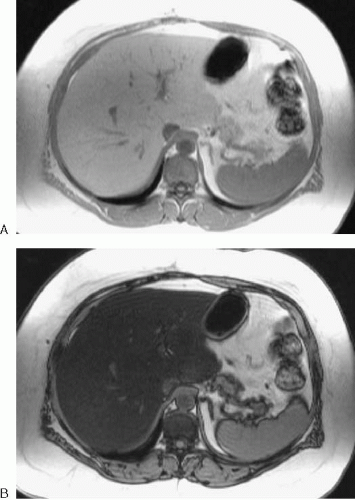 FIG. 3.34. Diffuse hepatic steatosis. A: In-phase T1-weighted gradient echo image demonstrates homogeneous, slightly increased signal intensity of liver. Note liver is hyperintense relative to spleen. B: Opposed-phase image obtained during same sequence shows diffuse loss of hepatic signal intensity. Liver is hypointense relative to spleen. |
Description: Hepatocellular lipid accumulation
T1: Diffuse increased signal intensity (altered signal intensity may be subtle or absent with mild degrees of steatosis).
T2: Slightly hyperintense on non-fat-saturated fast spin echo images (altered signal intensity may be subtle or absent with mild degrees of steatosis).
Enhancement pattern: normal.
Characteristic features: Diffuse loss of signal intensity on opposed-phase (relative to in-phase) gradient echo images. Lacks mass effect on vessels or bile ducts, which can be seen coursing normally through the fatty liver.
Distribution: Diffuse with areas of focal sparing. Sparing is common around the gallbladder fossa or adjacent to the left portal vein in the medial segment.
Associations: Pregnancy, diabetes, alcohol abuse, obesity, hyperlipidemia, glycogen storage disease, steroids, chemotherapy.
Mimics: A focal hepatic mass may mimic an area of focal fatty sparing.
Additional comments: Because lipid is delivered to the liver via the portal vein, portions of the liver with diminished portal blood flow may demonstrate sparing in the setting of hepatic steatosis. Therefore, a pattern of segmental fatty sparing should prompt a search for abnormality of the feeding portal branch. MR spectroscopy may have utility in quantifying intracellular lipid in hepatic steatosis. Although fatty infiltration is often thought of as a benign condition, steatohepatitis can progress to cirrhosis in some patients. Obese, type II diabetics appear to be at particular risk for this complication.
References: 39
Hepatic Vein Thrombosis or Occlusion (Budd-Chiari Syndrome) (Figs. 3.35, 3.36)
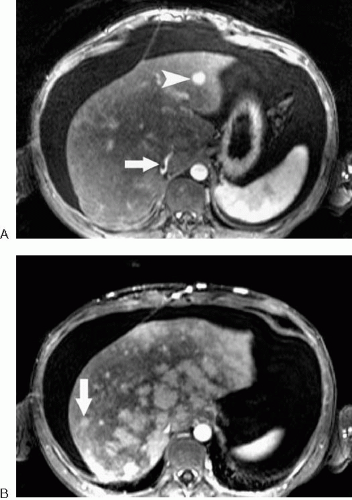 FIG. 3.35. Hepatic vein thrombosis. A: Fat-suppressed, gadolinium-enhanced T1-weighted image shows filling defect in inferior vena cava (arrow) and enhancing nodule in left lateral segment (arrowhead). Normal hepatic veins could not be detected on any image. B: More delayed image cephalad to (A) shows heterogeneous enhancement with diminished enhancement of liver periphery. Persistent enhancing nodule is also present (arrow). Nodules such as these are typical for regenerative nodules of Budd-Chiari syndrome. |
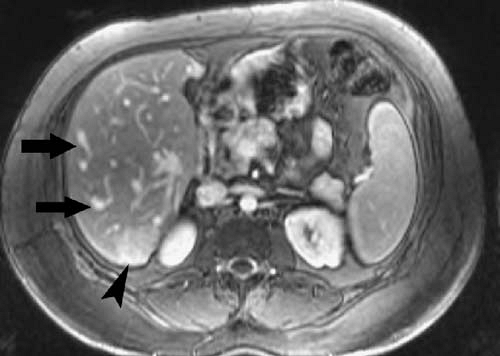 FIG. 3.36. Hepatic vein obstruction. Fat-suppressed, gadolinium-enhanced T1-weighted image in patient with large focal nodular hyperplasia (FNH) (not shown) obstructing hepatic veins near confluence. Note abnormal comma-shaped veins (arrows) at liver periphery. Incidental note is made of presumed second FNH (arrowhead). |
Description: Thrombosis of one or more of the hepatic veins.
T1: Peripheral hepatic edema may manifest as decreased signal intensity in the acute phase.
T2: Peripheral hepatic edema manifests as increased signal intensity in the acute phase.
Enhancement pattern: Heterogeneous, with diminished enhancement of the liver periphery and preferential enhancement of caudate lobe in acute hepatic vein occlusion. As intrahepatic venous collaterals develop over time, heterogeneous peripheral enhancement occurs.
Characteristic features: Nonvisualization of the hepatic veins. Disorganized hepatic venous collaterals sometimes resembling “comma” shapes may become visible over time (see Fig. 3.36). Hypertrophy of the caudate lobe and central liver, ascites, and portal hypertension occur with longstanding hepatic vein occlusion. Regenerative nodules in chronic Budd-Chiari syndrome typically are isointense or hyperintense on T1-weighted images and have variable signal intensity on T2-weighted images. These nodules tend to enhance considerably on early gadolinium-enhanced images, and enhancement may persist into the portal venous phase (see Fig. 3.35).
Distribution: Hepatic vein occlusion may involve one or more hepatic veins or the suprahepatic inferior vena cava (IVC).
Associations: Oral contraceptive use, myeloproliferative disorders, antiphospholipid syndrome, antithrombin III deficiency, factor V Leiden, paroxysmal nocturnal hemoglobinuria, protein C deficiency, protein S deficiency, other hypercoagulable states.
Mimics: Elevated right heart pressure may result in delayed enhancement of enlarged hepatic veins and mosaic enhancement of the hepatic parenchyma. Hepatic veins and IVC may be attenuated and poorly visualized in cirrhosis.
Additional comments: Regenerative nodules associated with Budd-Chiari syndrome may be indistinguishable from HCC by imaging alone. Most hepatic nodules associated with Budd-Chiari syndrome are benign, although HCC may occur, particularly if risk factors for HCC exist (e.g., viral hepatitis).
Iron Deposition (Fig. 3.37)
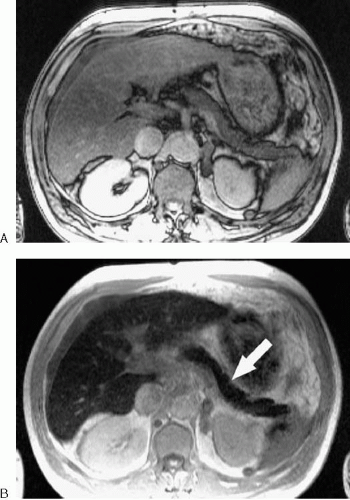 FIG. 3.37. Hepatic iron deposition. Opposed-phase (A) and in-phase (B) gradient echo images of patient with primary hemochromatosis demonstrate signal loss in liver and pancreas (arrow) on in-phase image (B). |
Description: Occurs with primary hemochromatosis and transfusional hemosiderosis.
T1: Signal intensity of liver decreased or normal.
T2: Signal intensity of liver decreased. Mild iron deposition may be evident on T2 or T2*-weighted images when signal intensity on T1-weighted images is normal.
Enhancement pattern: Normal.
Characteristic features: As a rule of thumb, abnormal iron deposition is characterized by liver parenchyma that appears darker than skeletal muscle on all pulse sequences. Hepatic signal loss is exacerbated on T2*-weighted (long TE) gradient echo sequences. Primary hemochromatosis eventually leads to cirrhosis (rare with transfusional iron overload).
Distribution: Entire liver.
Associations: Primary (genetic) hemochromatosis, cirrhosis, multiple blood transfusions, paroxysmal nocturnal hemoglobinuria, thalassemia, Bantu siderosis.
Additional comments: Primary hemochromatosis is a genetic abnormality resulting in excessive gastrointestinal absorption of iron and iron deposition in various organs including liver, pancreas, skin, heart, and pituitary. In hemochromatosis, hepatic iron deposition is primarily within hepatocytes. Transfusional iron overload results in iron deposition in the reticuloendothelial system (Kupffer cells) as a result of multiple blood transfusions. Splenic accumulation of iron is typical of transfusional iron overload, but not primary hemochromatosis.
References: 43
Portal Vein Thrombosis (Fig. 3.38)
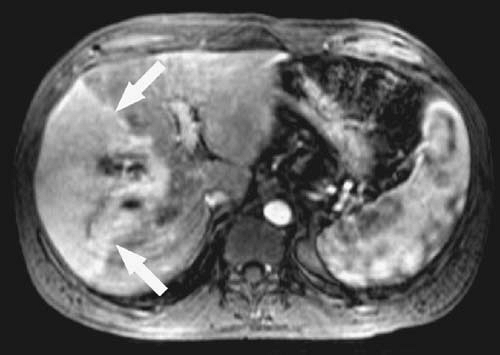 FIG. 3.38. Acute thrombosis of the anterior segment branch of right portal vein. Note wedge-shaped enhancement (arrows) of territory supplied by thrombosed portal branch. |
Description: Occlusion of the main portal vein or a portal vein branch by clot or tumor.
T1: Most commonly intermediate signal intensity with loss of flow void or flow related enhancement (gradient echo sequences). Subacute thrombus may appear as high signal intensity (see Fig. 2.21A).
T2: Intermediate to high signal intensity of thrombus with loss of flow void in affected vein. Liver parenchyma supplied by thrombosed vessel may show increased signal intensity on T2-weighted images.
Enhancement pattern: May be associated with increased enhancement of the involved segments during the arterial phase, particularly in the periphery, related to a compensatory increase in arterial flow. Pattern may appear as the opposite of hepatic vein thrombosis, in which enhancement tends to be central. Abnormal venous mural enhancement may be present with septic thrombophlebitis.
Characteristic features: Bland thrombus typically does not enhance after contrast injection. Tumor thrombus often enhances in a similar manner to the primary tumor. HCC has a predilection for invading the portal venous system and, less commonly, the hepatic venous system. Tumor thrombus tends to expand the vessel lumen, whereas bland thrombus typically does not. The chronic form of portal vein thrombosis manifests as multiple collateral veins in the porta hepatis and periportal regions (referred to as cavernous transformation) (see Fig. 2.22). Stigmata of portal hypertension (e.g., varices, splenomegaly) may be present with the chronic form.
Distribution: May involve main, right, left, or segmental veins. Involvement by tumor is typically contiguous with the primary lesion with retrograde growth into the more central portal veins.
Associations: Hypercoagulable states, malignant tumors (most commonly HCC), cirrhosis.
Mimics: Flow artifact.
References: 44
Primary Sclerosing Cholangitis (Fig. 3.39; see Fig. 2.36)
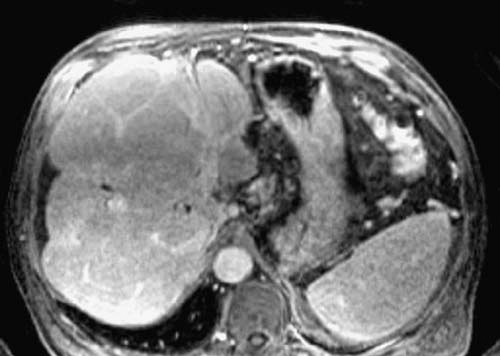 FIG. 3.39. Primary sclerosing cholangitis. Fat-suppressed, gadolinium-enhanced T1-weighted image of the liver in patient with sclerosing cholangitis demonstrates typical lobular pattern of fibrosis and liver regeneration. This is same patient as in Figure 2.36. |
Description: Chronic, progressive inflammatory and fibrotic disease of the intrahepatic and extrahepatic bile ducts.
T1: Fibrosis may appear as low signal intensity bands.
T2: Peripheral wedge-shaped or reticular areas of increased signal intensity are relatively common, presumably the result of fibrosis. Periportal inflammation and edema may result in periportal increased signal intensity on T2-weighted images.
Enhancement pattern: Increased arterial phase enhancement may be present in the periphery of the liver. Bile duct wall enhancement is typical. A modest degree (3 to 4 mm) of bile duct wall thickening may be present, particularly on gadolinium-enhanced T1-weighted images. However, bile duct wall thickening greater than 5 mm suggests the presence of cholangiocarcinoma.
Characteristic features: Primary sclerosing cholangitis is characterized on magnetic resonance cholangiopancreatography (MRCP) by multiple strictures of the intrahepatic and extrahepatic bile ducts due to progressive periductal fibrosis. Biliary dilatation may be present between strictures, creating a characteristic beaded appearance of the ducts. However, because of the periductal inflammation and fibrosis present with this disease, the intrahepatic bile ducts may not dilate to the extent typical of more focal causes of biliary obstruction. Eventually, the fibrotic process obliterates the peripheral duct lumens, resulting in the appearance of pruning. Cirrhosis develops as a late sequela of sclerosing cholangitis, resulting in a lobulated liver contour with caudate lobe hypertrophy. Lateral and posterior segment atrophy may also be present more commonly than in other forms of cirrhosis. Associated periportal lymphadenopathy is common.
Distribution: Involves intrahepatic ducts, extrahepatic ducts, or both.
Atypical appearances: Intraductal stones are uncommon.
Associations: Most cases of primary sclerosing cholangitis occur in patients with inflammatory bowel disease (up to three fourths of patients, most commonly with ulcerative colitis). However, primary sclerosing cholangitis never develops in the great majority of patients with inflammatory bowel disease. Between 5% and 15% of patients with primary sclerosing cholangitis develop cholangiocarcinoma.
Mimics: Infectious cholangitis (including human immunodeficiency virus-associated cholangiopathy), biliary ischemia.
Sarcoidosis (Fig. 3.40)
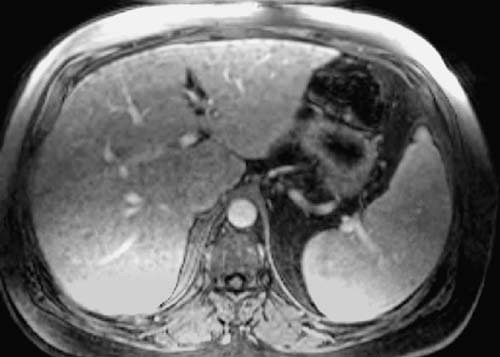 FIG. 3.40. Hepatic sarcoidosis. T1-weighted gradient echo image demonstrates multiple low signal intensity nodules throughout the liver. Biopsy revealed typical noncaseating granulomas. |
Description: Systemic disease of unknown etiology characterized by noncaseating granulomas. Liver involvement is common histologically.
T1: Typically low signal intensity.
T2: Typically low signal intensity.
Enhancement pattern: Diminished enhancement relative to normal liver parenchyma.
Characteristic features: Multiple, subcentimeter low signal intensity nodules throughout the liver. Abdominal lymphadenopathy and splenomegaly may be present.
Distribution: Diffuse.
Mimics: Other granulomatous processes, regenerative nodules.
Additional comments: Focal splenic lesions of sarcoidosis resemble hepatic sarcoid lesions.
References: 48
Gallbladder
Adenomyomatosis (Fig. 3.41)
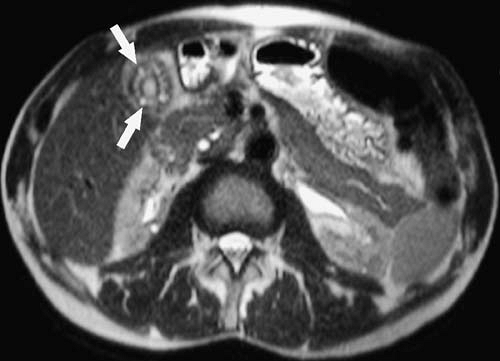 FIG. 3.41. Adenomyomatosis of gallbladder. Axial HASTE image demonstrates thickening of the gallbladder wall with multiple high signal intensity cystic spaces (arrows). |
Description: A hyperplastic cholecystosis characterized by intramural diverticula (Rokitansky-Aschoff sinuses) extending into the thickened muscular layer.
T1: Diverticula may be of variable signal intensity depending on cholesterol content.
T2: Diverticula may be visible as high signal intensity foci within the gallbladder wall.
Enhancement pattern: Diverticula do not enhance with intravenous gadolinium but may fill with hepatobiliary agents.
Characteristic features: Thickened gallbladder wall with intramural diverticula.
Distribution: May be focal, diffuse, or annular.
Atypical appearances: Annular form may obstruct a portion of the gallbladder, resulting in cholecystitis (Fig. 3.42).
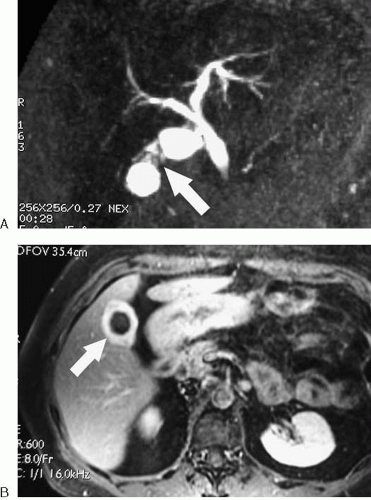 FIG. 3.42. Adenomyomatosis of gallbladder with acute cholecystitis. A: Coronal magnetic resonance cholangiopancreatography image demonstrates stenosing adenomyomatosis of the gallbladder (arrow) obstructing gallbladder fundus. B: Fat-suppressed, gadolinium-enhanced T1-weighted image of same patient as in (A) shows thickened, enhancing gallbladder fundus (arrow). Cholecystitis of gallbladder fundus was found at surgery. |
Associations: Cholesterolosis, cholelithiasis.
Mimics: Other causes of gallbladder wall thickening, including cholecystitis and carcinoma.
Additional comments: MRI has been shown to be more accurate than CT or ultrasound for the diagnosis of adenomyomatosis of the gallbladder. HASTE sequences are particularly useful in this regard.
Cholecystitis (Acute) (Fig. 3.43)
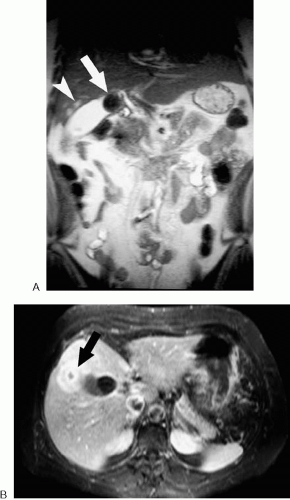 FIG. 3.43. Acute cholecystitis. A: Coronal HASTE image of patient with fever and right upper quadrant pain shows large stone (arrow) impacted in gallbladder neck. Note abnormal high signal foci in adjacent liver (arrowhead). B: Fat-suppressed T1-weighted image of liver demonstrates gallbladder wall enhancement and adjacent abnormal enhancement of liver (arrow). Pericholecystic abscess was found at surgery. |
Description: Inflammation of the gallbladder, usually caused by obstruction of the cystic duct.
T1: Signal intensity on non-contrast-enhanced images usually unremarkable.
T2: Pericholecystic fluid and edema manifest as increased signal intensity adjacent to the gallbladder. Edema may extend to the periportal regions. High signal intensity within the gallbladder wall may be seen as a result of intramural edema. Very bright intramural fluid collections may signify gallbladder wall necrosis.
Enhancement pattern: Markedly enhancing, thickened gallbladder wall. Mucosa typically enhances first. Early, transiently increased enhancement of adjacent liver may occur as a result of hyperemia.
Characteristic features: Uniformly thickened and enhancing gallbladder wall with surrounding edema or fluid. Gallstones usually present. With emphysematous cholecystitis, gas within the gallbladder wall or lumen is most conspicuous on T2*-weighted images.
Distribution: Diffuse mural involvement.
Atypical appearances: Stones absent in acalculous cholecystitis (severely ill patients). Hemorrhagic cholecystitis may demonstrate a complex thickened wall of variable signal intensity on T1- and T2-weighted images.
Associations: Cholelithiasis, cystic duct obstruction of any cause, interruption of blood supply via cystic artery (e.g., embolization). Most common in obese middle-aged women.
Mimics: Diffuse carcinoma and diffuse adenomyomatosis of the gallbladder can usually be distinguished from cholecystitis clinically, although these entities may coexist with cholecystitis (see Fig. 3.42). Gallbladder enhancement is usually less marked in other entities that cause gallbladder wall thickening. Chronic cholecystitis results in fibrosis and relatively less mural enhancement. Xanthogranulomatous cholecystitis, hepatitis, cirrhosis, hypoalbuminemia, portal hypertension, acquired immunodeficiency syndrome cholangiopathy, and graft-versus-host disease are additional causes of gallbladder wall thickening. However, wall enhancement and transient hepatic enhancement in these entities are absent or decreased relative to acute cholecystitis.
Cholelithiasis (Fig. 3.44)
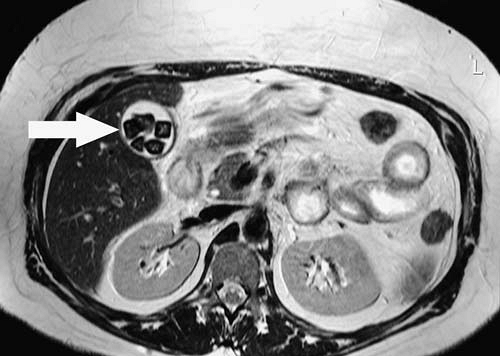 FIG. 3.44. Cholelithiasis. Multiple faceted stones are present within gallbladder (arrow) on respiratory-triggered T2-weighted image. |
Description: Stones within the gallbladder consisting of variable amounts of cholesterol, calcium carbonate, and pigment (bilirubin).
T1: Stones have variable signal intensity from dark to bright.
T2: Variable, but most commonly dark relative to bile. May have central area of increased signal intensity.
Enhancement pattern: None.
Characteristic features: Stones may be round, faceted, or laminated and show no enhancement after intravenous contrast injection.
Distribution: Single or multiple. Usually layer dependently but may float when specific gravity of stone is lower than bile.
Atypical appearances: May contain gas.
Associations: Cholestasis, inflammatory bowel disease, hemolytic diseases (pigment stones), metabolic disorders, familial predisposition.
Mimics: Gallbladder polyp (contrast enhancement excludes a stone). Gallbladder air.
Additional comments: Normal bile within the gallbladder has variable signal intensity on MR images. MR appearance of gallstones may provide a clue to their composition.
References: 53
Gallbladder Carcinoma (Fig. 3.45)
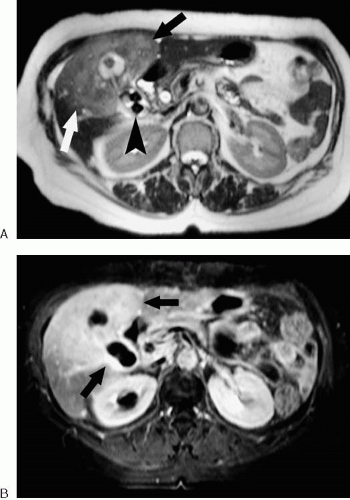 FIG. 3.45. Gallbladder carcinoma. A: Axial T2-weighted image shows large mass (arrows) originating from stone-filled gallbladder (arrowhead) and invading adjacent liver. B: Fat-suppressed, gadolinium-enhanced T1-weighted image shows enhancement of gallbladder and mass (arrows). |
Description: Malignant tumor of gallbladder origin, most commonly scirrhous adenocarcinoma.
T1: Intermediate signal intensity. Invasive tumor appears hypointense to liver.
T2: Hypointense to bile, hyperintense to liver.
Enhancement pattern: Heterogeneous early enhancement that persists on later images.
Characteristic features: Gallbladder wall thickening greater than 1 cm, a polyp greater than 2 cm, or a gallbladder mass that invades nearby structures suggest carcinoma. Direct extension into the adjacent liver is common.
Distribution: Most common in body and fundus of gallbladder. May appear as focal or diffuse thickening of the gallbladder or as a polypoid mass. Most common patterns of regional spread are direct liver invasion, lymph node metastases, and bile duct invasion. Omental or peritoneal metastases occur but may be difficult to detect.
Atypical appearances: Complete replacement of gallbladder by carcinoma.
Associations: Gallstones, chronic cholecystitis, ulcerative colitis, porcelain gallbladder.
Mimics: Acute or chronic cholecystitis (may coexist with carcinoma), xanthogranulomatous cholecystitis, gallbladder involvement by tumors not of biliary origin, adenomyomatosis.
Spleen
Cyst (Fig. 3.46)
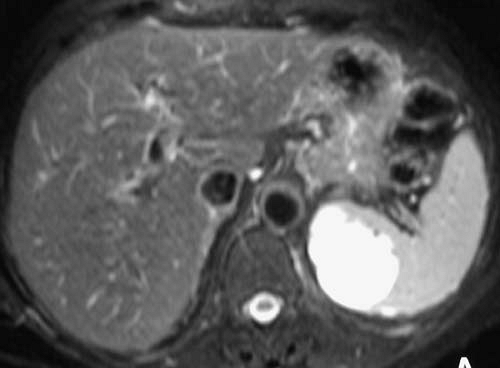 FIG. 3.46. Splenic cyst. Very high signal intensity lesion in medial spleen that showed no enhancement with contrast (not shown). This likely represents a pseudocyst rather than a true cyst. |
Description: Splenic cysts include true (developmental) cysts, pseudocysts, and hydatid cysts. True cysts are epithelial lined. Pseudocysts are posttraumatic or postinflammatory in nature and are far more common.
T1: Low signal intensity unless associated with hemorrhage.
T2: Very high signal intensity.
Enhancement pattern: Nonenhancing.
Characteristic features: Similar to cysts occurring in the liver. Most often unilocular.
Distribution: Usually solitary, but multiple cysts may occur.
Atypical appearances: May appear multilocular or septated.
Associations: History of trauma or inflammation.
References: 56
Gamna-Gandy Bodies (Fig. 3.47)
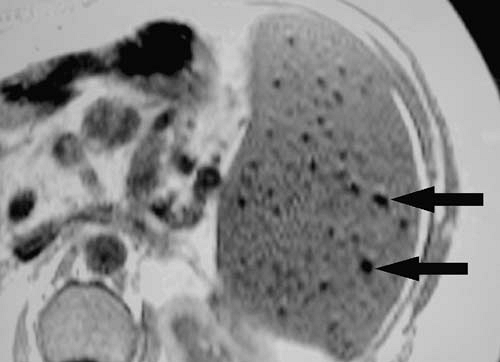 FIG. 3.47. Gamna-Gandy bodies. T1-weighted in-phase gradient echo image of the spleen in patient with cirrhosis and portal hypertension shows multiple dark (siderotic) nodules (arrows) within the spleen. |
Description: Siderotic foci within the spleen.
T1: Very low signal intensity. Lesions become more conspicuous on gradient echo images with increasing echo time (blooming effect).
T2: Very low signal intensity.
Enhancement pattern: Nonenhancing.
Characteristic features: Multiple subcentimeter foci of very low signal intensity commonly seen in the setting of cirrhosis and chronic portal hypertension.
Distribution: Multiple, diffuse.
Associations: Cirrhosis and chronic portal hypertension.
Mimics: Calcified granulomas.
Hamartoma, Splenic (Fig. 3.48)
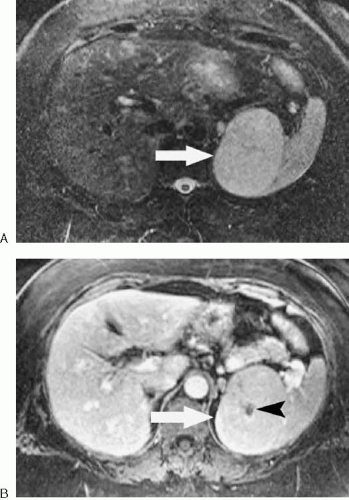 FIG. 3.48. Splenic hamartoma. A: Fat-suppressed T2-weighted image demonstrates mass (arrow) arising from and slightly hyperintense to spleen. B: Fat-suppressed, gadolinium-enhanced T1-weighted gradient echo image shows mass (arrow) to enhance similarly to spleen. Note central scar (arrowhead). |
Description: Benign splenic mass consisting of disorganized splenic tissue.
T1: Mildly hypointense to isointense compared with spleen.
T2: Isointense to mildly hyperintense compared with spleen.
Enhancement pattern: Enhances early, diffusely, and somewhat heterogeneously and becomes more homogeneous with time. Enhancement may persist. May exhibit central area of nonenhancement.
Characteristic features: An incidentally found, solitary, well-circumscribed and spherical lesion that is only mildly or moderately different in signal intensity from spleen on all pulse sequences suggests the diagnosis.
Distribution: Usually solitary. Occurs anywhere in the spleen.
Atypical appearances: May appear as a low signal intensity mass on T2-weighted images.
Mimics: Solitary mass of lymphoma, sarcoma.
References: 59
Hemangioma, Splenic (Fig. 3.49)
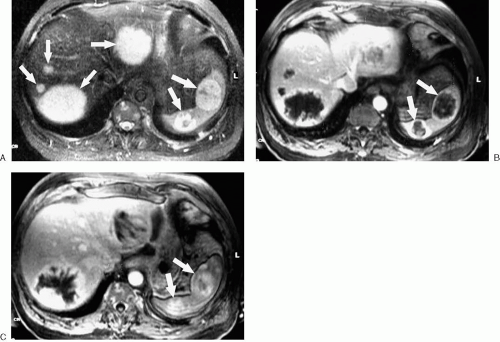 FIG. 3.49. Splenic hemangiomas in patient with blue rubber bleb nevus syndrome. A: Fat-suppressed T2-weighted image shows multiple high signal intensity masses (arrows) in liver and spleen. Early (B) and delayed (C) images from fat-suppressed, dynamic gadolinium-enhanced sequence show progressive enhancement of liver and splenic (arrows) lesions.
Related posts:Stay updated, free articles. Join our Telegram channel
Full access? Get Clinical Tree
 Get Clinical Tree app for offline access

|


