Fig. 5.1
Simple hepatic cyst seen on curvilinear 2.5 MHz transcutaneous transducer. There are 3 observations to be gleaned from this image. (i) Optimization of gray scale with liver parenchyma appearing the same throughout image depth of 10 cm as seen in the dotted scale on the left of the frame. (ii) Anechoic cyst with post-cyst enhancement. (iii) Velocity displacement with the far field liver capsule appearing as a hyperechoic linear structure in the path of the post-cyst enhancement (see Figs. 5.7 and 5.8)
Anechoic regions of the image are areas that are not reflective and, therefore, do not produce a returning echo signal to the transducer; these objects have a black appearance.
One can think of an anechoic structure as being completely uniform with no tissue interfaces off which a signal can bounce. The classic example of a normal anechoic region is the lumen of the normal gallbladder, which is essentially a cyst cavity containing liquid bile (see discussion of “Clinical Classification” below). The classic abnormal anechoic image is that of a simple liver or kidney cyst (Fig. 5.1).
Hypoechoic tissues have less cellular interfaces per unit area and usually have a high fluid density making them less reflective than surrounding parenchyma. A good example of this is the hepatic carcinoid metastasis, which is homogeneously “darker” in gray scale than the surrounding liver parenchyma (Fig. 5.2).
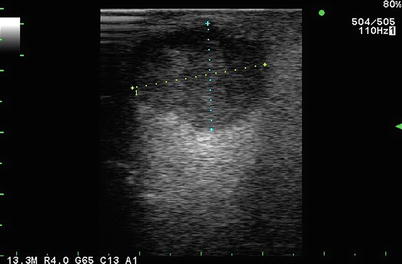
Fig. 5.2
Hypoechoic mass in liver seen on laparoscopic linear array imaging. This is typical of a metastatic carcinoid, exhibiting low to mixed echogenicity with significant post-lesion enhancement. Certain neuroendocrine lesions are so hypoechoic as to resemble cysts. Note the increased echogenicity (enhancement) beyond (or deep to) the lesion (1)
The classic hyperechoic lesion is represented by the small hepatic hemangioma that is described as a sharp-edged, uniformly hyperechoic lesion that, when visualized, is said to illuminate like a light bulb (Fig. 5.3). A hyperechoic tissue is one that typically has denser cellular structure with more membrane interfaces than surrounding structures. For example, the pancreas is more echo-dense than the liver, and the renal collecting system, which is a dense connective tissue tubular structure, “whiter” than the surrounding renal cortex. Hyperechoic tissue can also be linear where there is a large difference in interface density between adjacent structures. The best example of this is the wall of the gallbladder and its juxtaposition with the lumen, which is anechoic (see discussion of “Artifacts of Modality Limitation” below).
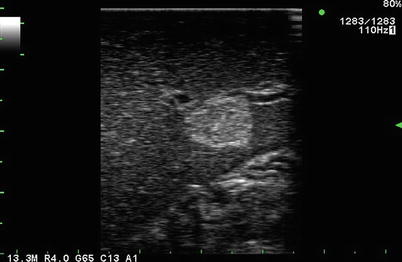
Fig. 5.3
Laparoscopic linear array 13.3 MHz transducer. Typical hyperechoic, well-circumscribed small hepatic hemangioma seen on laparoscopic ultrasound of segment III of the liver. In this image, there has been failure to create a uniform near-field gray scale of the liver when compared to Fig. 5.1
An additional lesion is one of mixed echogenicity where, as the term implies, has components of its structure that vary from anechoic to hyperechoic. A typical example of this is the necrotic pancreatic or hepatic tumor with an area of central anechoia surrounded by growing tumor and compressed parenchyma, giving it a spectrum of density as seen on ultrasound (Fig. 5.4).
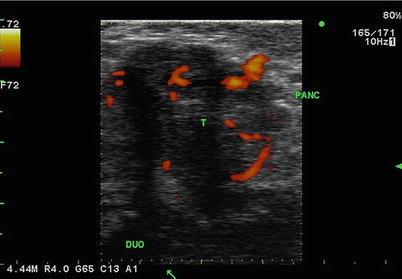
Fig. 5.4
Mixed echogenicity. Transverse image of head of pancreas (PANC) and duodenum (DUO) with pancreas tumor (T). Here demonstrated in this tumor is central hypoechoic necrosis with scalloped margins that are variably defined. The orange areas are blood vessels seen in color duplex mode
Isoechoic regions of an image are those areas that have similar interface density to the surrounding structures but, by definition, have other characteristics that differentiate them from surrounding normal tissue. There is no reason to describe normal structures as isoechoic or “isodense” with surrounding tissue, but a pathologic entity can be described as isoechoic or isodense to its surrounding or host organ. An example of this is an isoechoic hepatic colorectal metastasis (Figs. 5.5 and 5.6), where there is a subtle visible margin that allows identification of the lesion within the adjacent liver tissue. This is usually possible because of the interruption of normal vascular arborization patterns within the liver that allow us to identify an isoechoic lesion. What makes this possible in ultrasound is the ability to see architecture in real time as the transducer moves over the organ and allows the examiner to identify a tissue interruption as evidenced by displacement or distortion of normal vascular architecture. In trying to save this as a static image, the isoechoic lesion is often indistinguishable from surrounding normal parenchyma, thereby reinforcing the value of surgeon-performed, real-time, image acquisition.
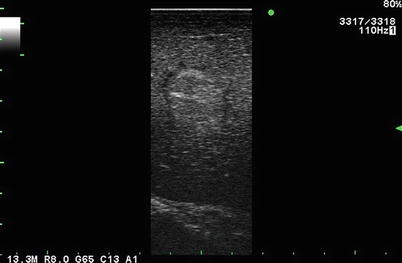
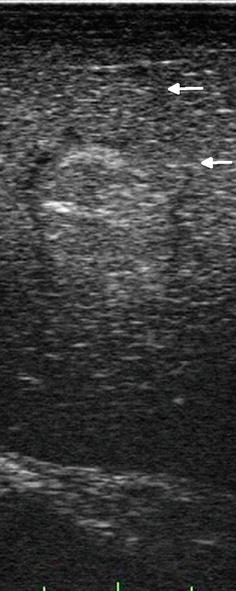
Fig. 5.5
Near isoechoic lesion in liver. This lesion is identified by the presence of a hypoechoic rim (margin) seen during laparoscopic side-fire, linear array imaging
Fig. 5.6
On closer inspection, there are two truly isoechoic “daughter” lesions seen (arrows). These lesions are less subtle when real-time motion is used to scan the liver
Understanding Sonographic Artifacts
In the following discussion, we will describe ultrasound artifacts in two ways. First, we will address the physics of ultrasound artifacts. More relevant, however, we will attempt to provide a clinical classification of ultrasound artifacts that will help us use them as invaluable aids to better image the abdomen and arrive at more accurate sonographic diagnoses by their very existence.
The Physics of Ultrasound Artifacts
Ultrasound imaging is based upon using a transducer for converting electrical energy into pulsed mechanical sound energy via piezoelectric crystals into a scanned volume of tissue. The returning echoes are converted back into electrical energy that is then interpreted and converted into a two-dimensional gray-scale image. The device software is designed to receive signals from tissues that are predominantly water containing (the human body is comprised of approximately 53 % water), and the average transmission of sound waves in the human body is about 1,540 m/s. As a result, when an outgoing signal passes through a gas-containing structure (stomach or colon), the transmission of that signal slows down to approximately 330 m/s which upsets the ability of the “listening” cycle of the device to locate the echo.
Sonographic artifacts are images generated that do not have a true corresponding anatomic component. The ultrasound probe and processor rely on fixed assumptions of the pulsed echo they generate, including a constant speed of sound through human tissue (1,540 m/s), a uniform attenuation of signal as the beam travels further away from its origin, and the assumption that the beam travels straight and is reflected once. Often the beam is altered by its interaction with tissue, and the assumptions are no longer valid. Artifacts typically result from the following three common diversions from the above assumptions:
Attenuation that is not uniform
Wave propagation this is not straight and may have a variety of paths
A change in the velocity of the signal
Understanding sonographic artifacts helps surgeons avoid pitfalls of misinterpretation of images, improve the quality of their scans, and use the peculiar characteristics of these artifacts to their advantage to clarify tissue morphology to improve their diagnostic capabilities.
In the following section, we will discuss the commonly encountered sonographic artifacts, the understanding of which will lead to a better ability to arrive at an accurate clinical diagnosis. This will give the surgeon ultrasonologist the ability to interpret findings as either representative of real anatomy or pathology or arising from an artifact consequent to the nature of the physical principles governing ultrasonography.
Attenuation
The ultrasound is pulsed energy converted into mechanical waves. Piezoelectric crystals in the transducer are where packets of energy are converted into vibrations. These vibrations are then propagated as mechanical waves through tissues. As the pulses of the ultrasound beam travel through tissue, the signals can weaken and lose energy and intensity due to redirection (reflection, scatter) and absorption. The diversion of energy away from the detector results in decreased or weakened returned signals and, therefore, decreased signal intensity and is known as attenuation. Modern ultrasound devices have a combination of manual (slide rules) and automatic gain detection software that spontaneously compensates for signal attenuation. The automatic gain control (AGC) or time gain compensation (TGC) effectively acts to “increase the volume” of the listening device in order to augment the incoming echoes from structures further away from the transducer. Without this automatic device, an image seen, such as the homogeneous liver parenchyma in Fig. 5.1, would have to be manually adjusted using the slide rule devices on the ultrasound console.
If angle of incidence is perpendicular to a structure and the interface is “smooth,” a portion of the pulse’s energy is transmitted forward deeper through the tissue, while the remaining portion of the pulse’s energy is reflected back to the detector. This partially reflected echo is weaker in intensity and is known as specular reflection, which is a specific cause of attenuation.
Related posts:
 Introduction: The Importance of Ultrasound in a Surgical Practice
Abdominal Ultrasound: Credentialing and Certification
Introduction: The Importance of Ultrasound in a Surgical Practice
Abdominal Ultrasound: Credentialing and Certification
 Trauma Ultrasound
 Techniques in Laparoscopic and Intraoperative Ultrasound Guidance
 Abdominal Wall Anatomy, Pathology, and Intervention
 Percutaneous Ultrasound Guidance Techniques and Procedures
Stay updated, free articles. Join our Telegram channel

Full access? Get Clinical Tree


