Once the AV access has been in use, the most important factors that limit its survival are stenosis, thrombosis, and infection. In general, complications occur more commonly in grafts than in AV fistulas.
I. STENOSIS. Vascular access stenosis is a harbinger of thrombosis, reduces access blood flow, and can lead to underdialysis. The most common cause of stenosis in AV grafts is neointimal hyperplasia, which usually occurs at or just distal to the graft–vein anastomosis. In AV fistulas, the location and cause of stenosis is more varied, with the juxta-anastomotic region being a frequent site. Common sites of stenosis in AV fistulas and grafts are shown in Figures 8.1 and 8.2. Because access patency is much worse after thrombectomy than after elective angioplasty, current KDOQI guidelines recommend prospective monitoring and surveillance of AV fistulas and grafts for hemodynamically significant stenosis. Not all guidelines recommend routine monitoring, however, and there is controversy regarding the overall clinical benefit of maintaining an access surveillance program (Kumbar, 2012; Paulson, 2012). Randomized controlled trials have not consistently shown that surveillance improves outcomes in grafts; in fistulas, surveillance has been shown to reduce the rate of thrombosis, but may not prolong overall fistula life.
There are several strategies to detect stenosis prior to definitive visualization of the access tract by Doppler ultrasound and, in the case of central vein stenosis, by venography. These early detection strategies depend on indirectly observing access pressure, flow, or recirculation during dialysis. The optimum early detection strategy differs somewhat for fistulas versus grafts, and for forearm versus upper arm locations. The basic principles are these: (a) Recirculation of dialyzed blood across the access device immediately back through the dialysis circuit does not appear until access flow decreases to a level near to or less than flow in the extracorporeal circuit. Thus, barring inadvertent needle reversal or improper needle placement, access recirculation will not be present until access flow falls to the range of 350–500 mL/min. At this range of flow, AV grafts are already at high risk for thrombosis, so if true recirculation is detected in an AV graft, it is an urgent indication to image the graft and correct the stenosis. On the other hand, in AV fistulas, continued patency is likely even when recirculation is present (flow in the 350–500-mL/min range). The benefits of screening AV fistulas for access recirculation are relatively small in terms of preventing thrombosis, but screening for recirculation is useful to prevent underdialysis. Access stenosis that occurs between the usual sites of needle insertion will not cause recirculation, but may markedly reduce access flow to thrombosis-prone levels. Stenosis in this location should be suspected when access flows are measured to be below the blood pump flow rate, but recirculation is not detectable. (b) Both grafts and fistulas commonly develop inflow stenosis, so strategies that detect inflow stenosis will be useful for both types of AV access. (c) Outflow stenosis occurs much more frequently in grafts than in forearm fistulas where the degree of neointimal hyperplasia is less and where accessory outflow veins often compensate for obstruction of a principal outflow channel. However, in upper arm fistulas, outflow stenosis is not uncommon. Hence, strategies that detect outflow stenosis will be more useful in monitoring function of AV grafts and of upper arm fistulas.
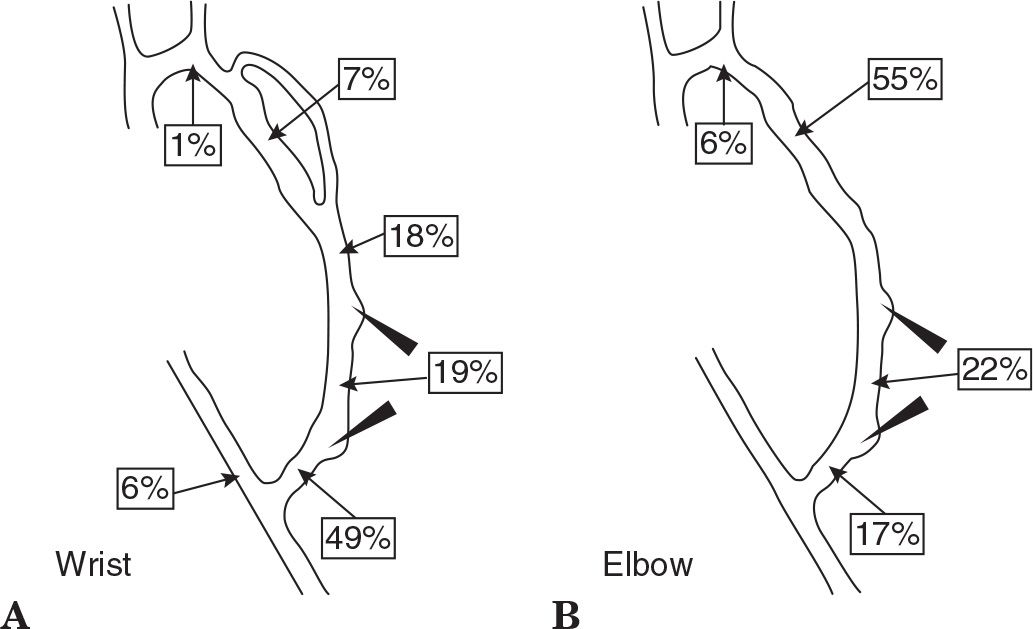
FIGURE 8.1 Common sites of stenosis in AV fistula. Locations are shown in fistulae created at wrist (A) and fistulae created at elbow (B). (From Turmel-Rodrigues L, et al. Treatment of stenosis and thrombosis in haemodialysis fistulas and grafts by interventional radiology. Nephrol Dial Transplant 2000;15:2032–2036, with permission.)
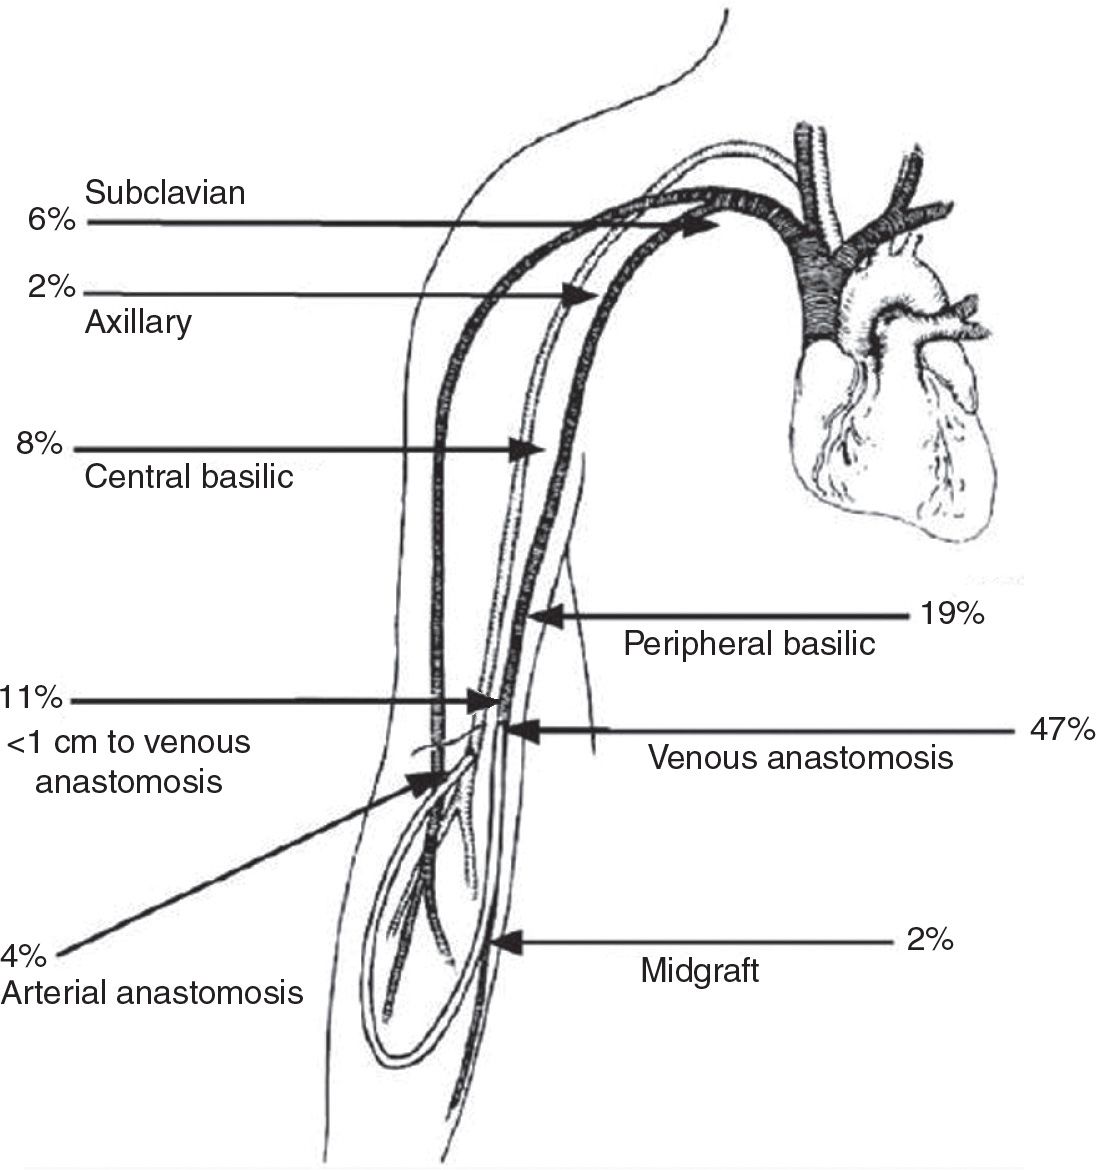
FIGURE 8.2 Common sites of stenosis in AV graft. (Reproduced from Roy-Chaudhury P, et al. Vascular access in hemodialysis: issues, management, and emerging concepts. Cardiol Clin. 2005;23:249–273, with permission from Elsevier.)
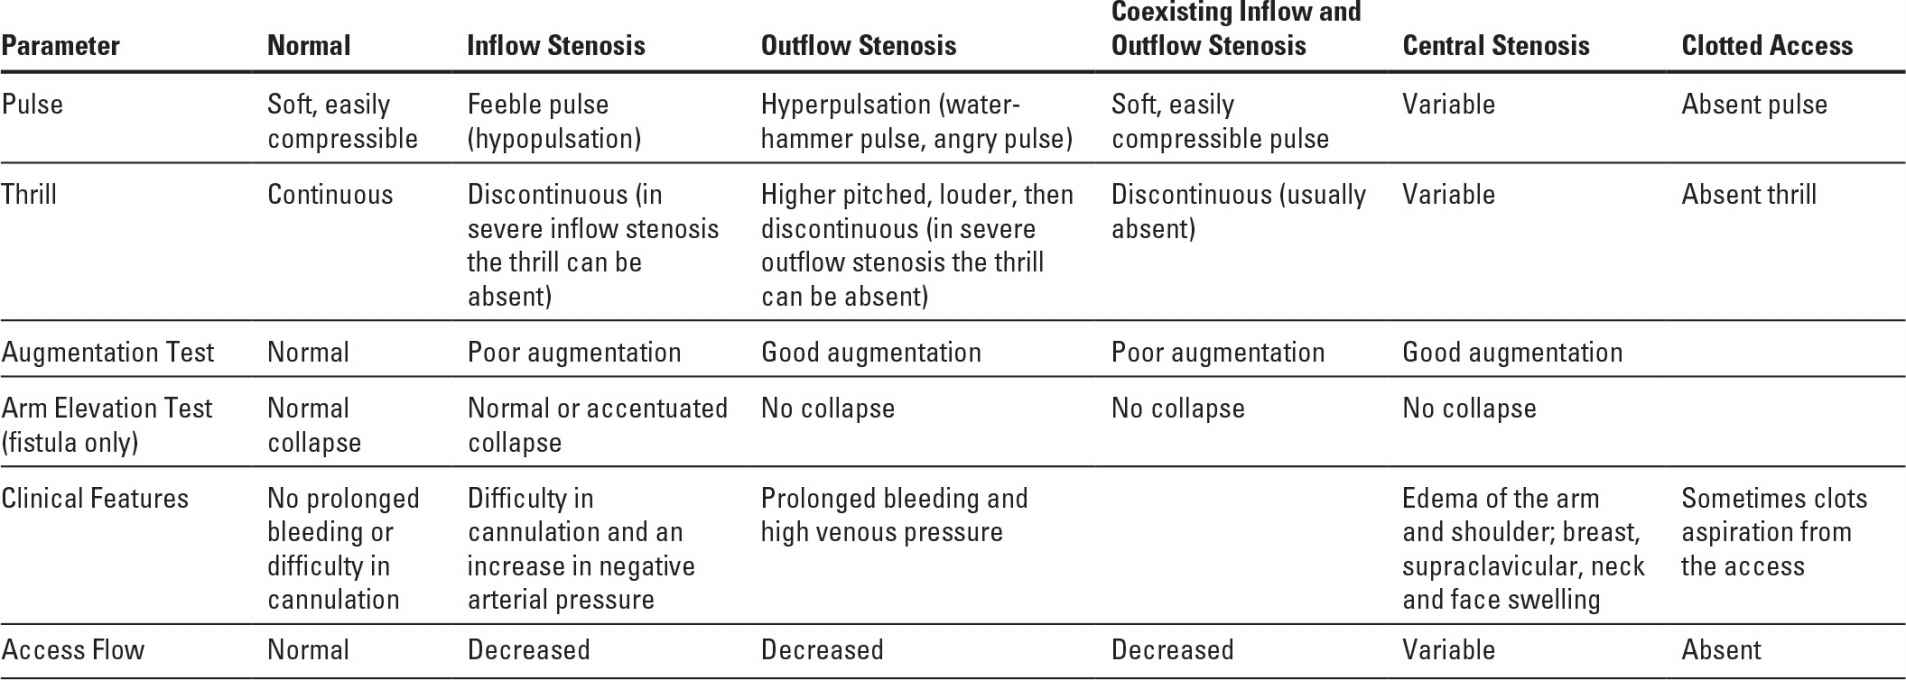
A. Physical examination of an AV access was discussed in some detail in Chapter 6. Table 8.1 shows the changes in physical findings with some common access complications. Physical examination can be quite useful in detecting isolated inflow or outflow access stenoses, but is less effective in detecting combined inflow and outflow lesions. The accuracy of physical examination is substantially higher if the persons doing the examination have received special training (Coentrão, 2012). The ESRD Network of Texas has sponsored some training documents and examples, which are available on the Web (Beathard, 2012).
B. Access surveillance using information obtained routinely during every dialysis session. Many dialysis machines have the option of measuring in vivo ionic dialysance. In all dialysis machines, the outflow venous pressure is monitored. Trending the results of these measurements over time can help detect access stenosis.
1. Trending ionic dialysance. The ionic dialysance measured via conductivity includes any access recirculation component if present; as the degree of access recirculation increases, the in vivo ionic dialysance will decrease, assuming that other features of the dialysis prescription (dialyzer K0A, blood and dialysate flow rates, heparinization) are kept constant. Dialysis machines that measure ionic dialysance typically integrate the clearances measured during each treatment (K) to calculate a treatment Kt value (clearance × time) for that session. In one case series of six patients with AV fistulas, a sustained fall in Kt of 20% was associated with access recirculation (Fontseré, 2011). Another approach is to follow the ratio of ionic dialysance to blood flow. In one report, a ratio of ≤0.5 had a high sensitivity and specificity for access recirculation (Mohan, 2010).
Physical Findings with Various Forms of Access Dysfunction | |
2. Trending venous outflow pressures. Venous pressures are measured continuously during routine hemodialysis. Venous pressures are a function of needle size, hematocrit (by its effect on blood viscosity), and blood flow rate. All other things being equal, a progressive rise in venous pressure over time (weeks to months) is often due to access outflow stenosis (Zasuwa, 2010). Some large dialysis organization data systems are able to track such pressures and trend them over time, and one company in the United States (Vasc-Alert, Lafayette, IN) sells software that allows easy access to trended pressure data. One can also trend prepump arterial pressure, which will increase (in a negative direction) with worsening access inflow stenosis.
The sensitivity of pressure measurements during dialysis to detect access stenosis can be increased by focusing on measurements taken at the beginning of dialysis with the blood flow rate set at a low value (200–225 mL/min), because at high blood flow rates, much of the resistance to flow is from the needle and not the vascular access. A baseline pressure value should be established when the access is first used. The threshold pressure that triggers further evaluation depends on the size of the needle, blood viscosity, and other factors; for 15G needles, a starting venous pressure threshold to use might be >115–120 mm Hg; for 16G needles, the threshold might be >150 mm Hg. Such threshold pressures must be exceeded on three or more treatments in succession to be significant.
C. Periodic measurements of access blood flow rate. To what extent a low access flow rate reflects stenosis and an increased risk of thrombosis depends on the type of access. Flow through a forearm AV fistula commonly averages 500–800 mL/min, and in grafts, flow is somewhat higher, about 1,000 mL/min. Flow in upper arm fistulas or grafts may be considerably higher. AV fistulas may maintain patency at flows as low as 200 mL/min, whereas AV grafts begin to clot at access flows between 600 and 800 mL/min—flows that often provide adequate dialysis but offer few clinical premonitory signs that the access is at risk for thrombosis. The current KDOQI (2006) recommendations are to have the patient referred for access visualization if access flow is <600 mL/min or if the access flow is <1,000 mL/min and has decreased by >25% over the preceding 4 months. While regular surveillance of vascular access for stenosis has been shown to decrease thrombosis rates when compared with historical controls, recent prospective studies have not shown conclusively that detection of stenosis and correction with angioplasty improves graft survival.
1. Direct measurement of access flow by saline dilution. This method for measuring access blood flow during hemodialysis treatments was pioneered by Krivitski (1995). The required equipment is made by Transonic Systems, Inc. (Ithaca, NY) and consists of a control box, two matched flow/dilution sensors, a laptop computer, a data analysis software package, and a rolling stand that can be easily moved between patients (Fig 8.3). The setup shown in Fig. 8.3 is for measurement of access recirculation; hence the needles are not reversed. To measure access blood flow, one must deliberately cause access recirculation in the extracorporeal blood circuit by reversing the arterial and venous lines so that the dialyzer is fed from the downstream access needle (Fig 8.4). The degree of recirculation in such a system will depend on the ratio of the access blood flow rate to the rate of blood flow through the dialyzer. If the percentage recirculation and blood flow rate through the dialyzer are known, the access blood flow rate can then be calculated.
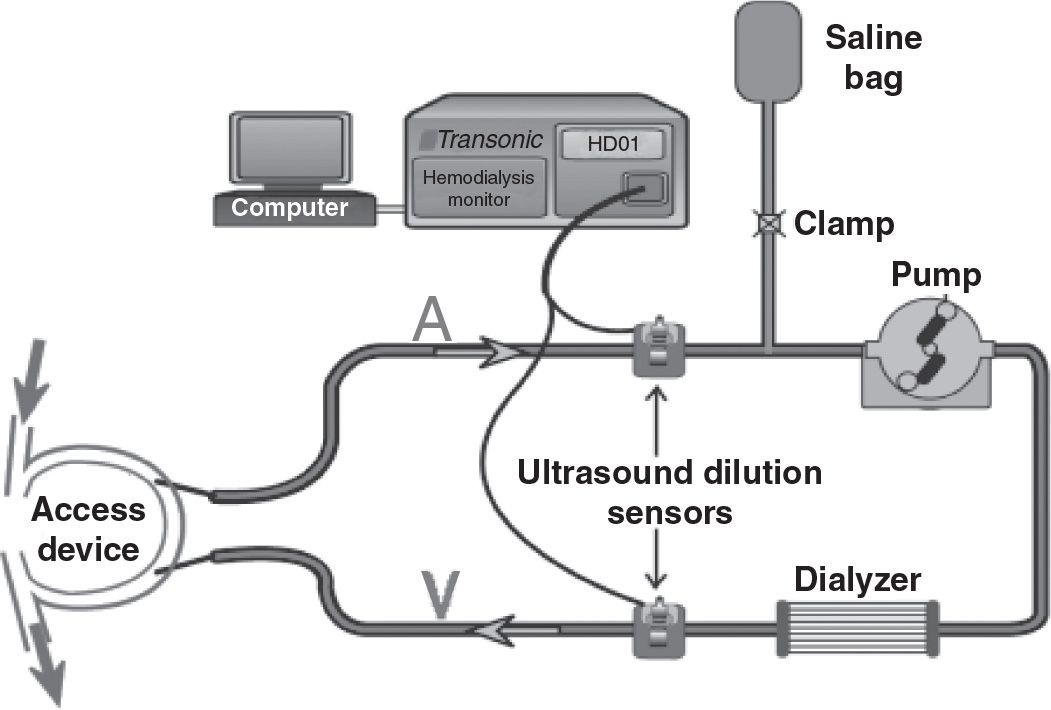
FIGURE 8.3 Setup to measure access recirculation by saline dilution and ultrasound detection. To measure access blood flow, the access needles need to be reversed (not shown). See text for description of the setup and method. (Reproduced with permission from Transonic Systems, Inc., Ithaca, NY.)
To measure the amount (percentage) of recirculation under needle-reversed conditions, a bolus of saline is injected into the blood leaving the dialyzer (Fig. 8.4). The amount of dilution in the outlet bloodline is measured by a downstream ultrasound sensor. The speed of sound through blood depends on the concentration of proteins in the plasma; accordingly, the dilution effect of the saline bolus in the outlet bloodline can be quantified using this first sensor. Some of this saline-diluted blood will then traverse the vascular access segment between the two needles and reappear at the dialyzer inlet. The proportion of the saline-diluted blood that reappears at the dialyzer inlet depends on the ratio of access blood flow to the blood flow through the dialyzer. A second ultrasound sensor on the bloodline leading to the dialyzer is then used to detect the proportion of saline-diluted blood that reappears at the dialyzer inlet (Fig. 8.4). In practice, an additional measurement of recirculation is made with the blood lines not reversed, as the presence of any recirculation under nonreversed conditions will affect the calculations.
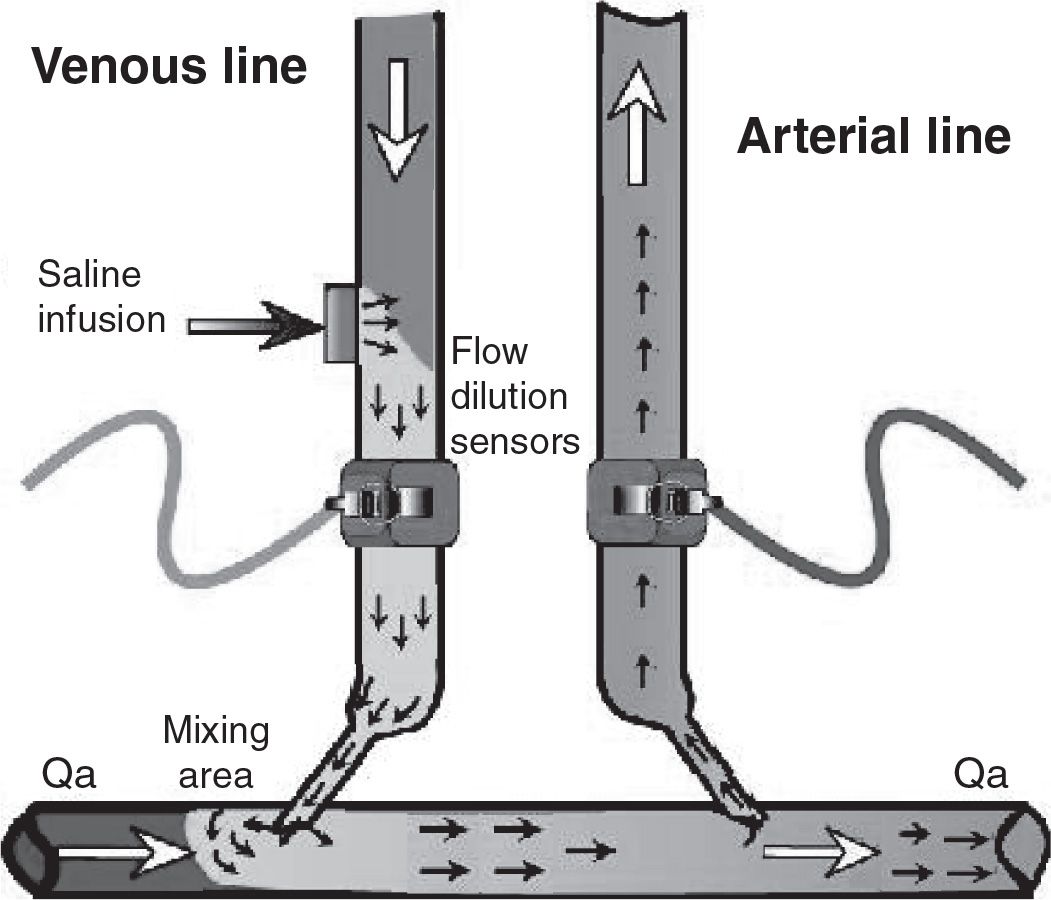
FIGURE 8.4 Measurement of access flow by saline dilution showing blood line reversal and position of blood line sensors. See text for details of the method. (Reproduced with permission from Transonic Systems, Inc., Ithaca, NY.)
2. Alternative measures of access flow using temperature, sodium, or hemoglobin changes. The Fresenius Blood Temperature Module has the ability to acutely change the temperature of the blood leaving the dialyzer, and the ionic conductivity module has the ability to acutely change the sodium concentration of blood leaving the dialyzer. This is done by abruptly altering the dialysis solution temperature or conductivity, respectively. This permits measurement of access blood flow rate in a similar method to saline dilution. The lines are reversed, the dialyzer blood outlet temperature or conductivity is altered, and the amount of this perturbation that gets transmitted to the dialyzer inlet via forced recirculation is calculated. The intervention is repeated without reversing the bloodlines as a control. Hemoglobin dilution using an online hemoglobin monitor has been used to measure access blood flow in an analogous fashion (Jiang, 2011; Roca-Tey, 2012). Evidence suggests that these alternative methods are fairly accurate in measuring access blood flow, with the temperature method perhaps performing at a higher level (Badr, 2014). The advantage of using temperature or ionic dialysance is that the need for a separate ultrasound dilution sensor and laptop computer is no longer required.
D. Doppler ultrasonography to measure access flow. Doppler ultrasonography, though usually used to detect stenotic lesions directly, can also be used to measure the rate of flow through a vascular access. A variety of machines and several different flow velocity algorithms have been used. There is systematic underestimation or overestimation of flow by some machines. Flow measurement by Doppler depends on an accurate measurement of both velocity and vessel diameter. This may be difficult when flow is turbulent in an access and when the vessel diameter is not uniform. Because of these confounders, flow is better measured at the brachial artery, where the vessel is a smooth cylinder of blood and flow is nonturbulent. Almost all of the flow in the brachial artery (apart from about 60–80 mL/min nutrient flow) passes through the vascular access, and brachial artery flow correlates very well with access flow rate.
E. Intra-access pressure (PIA) and access flow. Flow, pressure, and resistance are mathematically related. In an AV graft, the PIA is usually <50% of MAP (mean arterial pressure). Most of this pressure drop occurs at the arterial anastomosis, unless there is intragraft stenosis. When outflow stenosis develops (e.g., due to neointimal hyperplasia at or downstream from the graft–vein anastomosis), PIA rises and flow decreases. When PIA rises above 50% of the MAP (PIA/MAP >0.50), graft flow commonly has decreased into the thrombosis-prone range of 600–800 mL/min, and the presence of stenosis is likely. Details of how to compute this ratio based on an equivalent PIA (EQPIA = PIA adjusted for the relative heights of the access measuring point and pressure transducer) are given in Table 8.2. In AV fistulas, blood entering the venous system returns via multiple collateral veins. As a consequence, PIA in an AV fistula, which is on average lower than in an AV graft, may not increase with outlet stenosis and is therefore less valuable as a surveillance tool.
If a stenosis develops in the body of an AV graft between the areas used for arterial and venous limb cannulation, PIA at the venous needle remains normal or can even decrease, despite increasing stenosis. Stenosis at the arterial anastomosis of both grafts and fistulas causes PIA to decrease, and a widely patent arterial anastomosis causes high basal PIA in the absence of stenosis.
Measuring the EQPIA/MAP Ratio | |
Example:
1.
Related posts:


Stay updated, free articles. Join our Telegram channel

Full access? Get Clinical Tree


